


The alpha-enhancement of stars in the bulge shows similar trends to that of the thin and thick disk in the solar neighbourhood, as reported by Alves Brito et al. (2013), Bensby et al. (2013) and Gonzalez et al.(2015).
The APOGEE survey includes observations across the Milky Way's disk and bulge and allows the [α/Fe] trends to be homogeneously mapped from the outermost to the innermost region of the Galaxy (see e.g. Hayden et al. 2015; Nidever et al. 2014). Comparing the [α/Fe] trends and the individual abundance patterns ([X/Fe]) for bulge stars with stars at other galactic radii is important for understanding the detailed formation of the bulge and its relationship with the disk. A large fraction of the bulge stars is likely to have come from the disk, and therefore the broad expectation would be that disk and bulge abundance trends will be similar. However, there are a number of perturbing processes that may show abundance signatures. These include the star formation rates in the inner and outer disk and the growth of the disk over time, gas inflow driving star formation, and radial migration. The alpha and abundance trends of the rare metal-poor stars in the inner Milky Way are particularly interesting due to the prediction that the oldest stars of the Galaxy will now be concentrated to the bulge (e.g. Doménech-Moral et al. 2012; Diemand et al. 2008; Tumlinson 2010)
Figure 6 shows the [Fe/H]–[α/Fe] maps for the APOGEE stars for different Galactic zones in R and z. The stellar parameters have been obtained with The Cannon (Ness et al. 2015) and demonstrate that the inner Galaxy has the narrowest alpha sequence, which is offset to higher metallicity than in the outer galaxy. The dotted line in Figure 6 marks the approximate trend of the high-alpha sequence that is seen in the innermost region. The density distribution shows that, in the zones further from the Galactic plane at a given radius, more stars are found in the low metallicity/high alpha sequence than in the high metallicity/low alpha sequence.
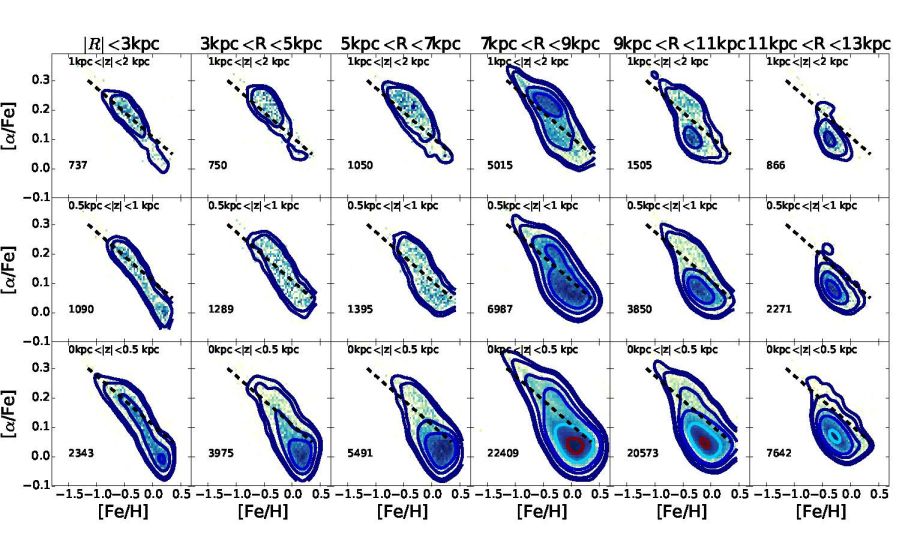 |
Figure 6. The [Fe/H]-[α/Fe] for the Milky Way from the Galactic center to RGC = 13 kpc. Three intervals of height z are shown, at increasing radii, for 0 < z < 0.5 kpc, 0.5 < z < 1 kpc and 1 < z < 2 kpc, for the bottom, middle and top panels respectively. The number of stars is indicated in the left hand corner of each sub-panel. The dashed line shows the sequence in the inner bulge and is included to help follow the trends in the [α/Fe] sequence with increasing radius. Note that the alpha sequence at small galactic radii in the bulge, the low and high alpha sequences are both present near the sun, and only the low-alpha sequence is present at the largest radii in the disk. narrows |
Figure 6 shows that there is a smooth transition from the outer to inner region at a given height from the plane, with an increasing mean metallicity. The low-alpha sequence dominates in the outer region and a narrower sequence extending to lower [Fe/H] and higher [α/Fe] dominates in the inner region. At intermediate radii, near the Sun, both low and high alpha sequences are present. The narrower and high-alpha sequence seen in the inner Galaxy implies that the star formation and chemical evolution rate was high at the early epoch in the disk at which the bulge stars were forming. The star formation continued over a relatively brief period, and this single sequence is a snapshot in time of the rapid chemical evolution of the early disk from which the bulge was formed. Athanassoula (2005) showed that bulges form early on after the disk, and over a short period of 1-2 Gyr. This rapid formation at early times is consistent with the single continuous alpha sequence seen in the inner 3kpc of the Milky Way that is observed in APOGEE data. The simulations of Di Matteo et al. (2015) show that stars are mapped into the bulge from the disk according to their initial phase space location. Stars now in the bulge that reside nearest to the plane originate from the innermost region of the disk. Similarly, the stars in the bulge whose orbits take them to higher z came from larger radii in the disk and preferentially at larger heights above the plane. Simulations that include star formation (e.g. Obreja et al. 2013; Calura et al. 2012) combined with new observational data e.g. from APOGEE which covers from the bulge and into the disk may offer insight into the observed chemodynamical distribution of stars across (l, b).