


Beyond the neutral ISM, strong Lyα absorbers of N(H I) ≈ 1014−20 cm−2 and associated metal-line absorbers offer a sensitive probe of the diffuse circumgalactic medium (CGM) to projected distances d ≈ 100−500 kpc (e.g., Fig. 2). But because the circumgalactic gas is significantly more ionized in the LLS and lower-N(H I) regime, measurements of its ionization state and metallicity bear considerable uncertainties and should be interpreted with caution.
Several studies have attempted to constrain the ionization state and metallicity of the CGM by considering the relative abundances of different ions at low- and high-ionization states (e.g., Savage et al 2002, Stocke et al 2006). For example, attributing observed O VI absorbers to cool (T ∼ 104 K), photo-ionized gas irradiated by the metagalactic ionizing radiation field, the observed column density ratios between O VI and low-ionization transitions (such as C III and C IV) require extremely low gas densities of nH ∼ 10−5 cm−3. Combining the inferred low gas density with observed N(O VI), which are typically ≳ 1014.5 cm−2 in galactic haloes (e.g., Tumlinson et al 2011), leads to a moderate gas metallicity of ≳ 1/10 Solar and unphysically large cloud sizes of lc ∼ 1 Mpc (e.g., Tripp et al 2001, Savage et al 2002, Stocke et al 2006) 2. Excluding O VI due to possible origins in shocks or turbulent mixing layers (e.g., Heckman et al 2002) and considering only relative abundances of low-ionization species increases estimated gas densities to nH ∼ 10−4 − 10−3 cm−3. The inferred cloud sizes remain large with lc ∼ 10−100 kpc, in tension with what is observed locally for the HVCs. The implied thermal pressures in the cool gas phase are still two orders of magnitude lower than what is expected from pressure equilibrium with a hot (T ≈ 106 K) medium (e.g., Stocke et al 2013, Werk et al 2014), indicating that these clouds would be crushed quickly. Considering non-equilibrium conditions (e.g., Gnat and Sternberg 2007, Oppenheimer and Schaye 2013) and the presence of local ionizing sources may help alleviate these problems (e.g., Cantalupo 2010), but the systematic uncertainties are difficult to quantify.
Nevertheless, exquisite details concerning extended halo gas have been learned over the past decade based on various samples of close galaxy and background QSO pairs. Because luminous QSOs are rare, roughly one QSO of g ≲ 18 mag per square degree (e.g., Richards et al 2006), absorption-line studies of the CGM against background QSO light have been largely limited to one probe per galaxy. Only in a few cases are multiple QSOs found at d ≲ 300 kpc from a foreground galaxy (e.g., Norman et al 1996, Keeney et al 2013, Davis et al 2015, Lehner et al 2015, Bowen et al 2016) for measuring coherence in spatial distribution and kinematics of extended gas around the galaxy. All of these cases are in the local Universe, because the relatively large angular extent of these galaxies on the sky increases the probability of finding more than one background QSO. This local sample has now been complemented with new studies, utilizing multiply lensed QSOs and close projected QSO pairs, which provide spatially resolved CGM absorption properties for a growing sample of galaxies at intermediate redshifts (e.g., Chen et al 2014, Rubin et al 2015, Zahedy et al 2016).
With one QSO probe per halo, a two-dimensional map of CGM absorption properties can be established based on an ensemble average of a large sample of QSO-galaxy pairs (Npair ∼ 100−1000). Fig. 6 summarizes some of the observable quantities of the CGM. First, panels (a) and (b) at the top display the radial profiles of rest-frame absorption equivalent width (Wr) for different absorption transitions, including hydrogen Lyα, low-ionization C II and Si II, intermediate-ionization Si III, Si IV, and C IV, and high-ionization O VI absorption transitions, colour-coded in black, red, orange, green, blue, magenta, and dark purple, respectively. For transitions that are not detected, a 2-σ upper limit is shown as a downward arrow. Because of the large number of data points, the upper limits are shown in pale colours for clarity. The galaxy sample includes 44 galaxies at z ≈ 0.25 from the COS-Halos project (open squares; Tumlinson et al 2011, 2013, Werk et al 2013) and ∼ 200 galaxies at z ≈ 0.04 from public archives (circles; Liang and Chen 2014), for which high-quality, ultraviolet QSO spectra are available for constraining the presence or absence of multiple ions in individual haloes. These galaxies span four decades in total stellar mass, from Mstar ≈ 107 M⊙ to Mstar ≈ 1011 M⊙, and a wide range in SFR, from SFR < 0.1 M⊙ yr−1 to SFR > 10 M⊙ yr−1. Diffuse gas is observed beyond d = 50 kpc around distant galaxies, extending the detection limit of H I gas in inner galactic haloes from 21 cm observations (e.g., Fig. 2) to lower column density gas at larger distances and higher redshifts.
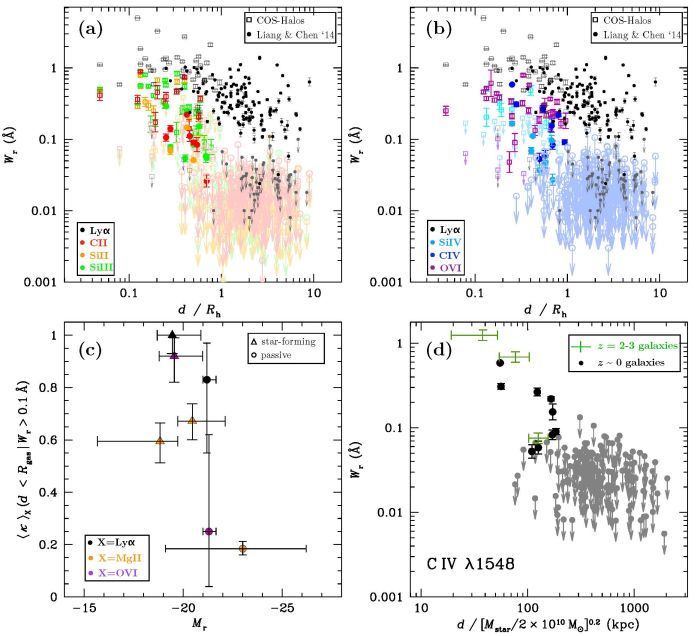 |
Figure 6. Observed absorption properties of halo gas around galaxies. The top panels display the radial profiles of rest-frame absorption equivalent width (Wr) versus halo-radius Rh-normalized projected distance for different absorption transitions. Low-ionization transitions are presented in panel (a) and high-ionization transitions in panel (b). Lyα data points are presented in both panels for cross-comparison. The galaxy sample includes 44 galaxies at z ≈ 0.25 from the COS-Halos project (open squares; Tumlinson et al 2011, 2013, Werk et al 2013) and ∼ 200 galaxies at z ≈ 0.04 from public archives (circles; Liang and Chen 2014), for which high-quality, ultraviolet QSO spectra are available for constraining the presence or absence of multiple ions in individual haloes. Different transitions are colour-coded to highlight the differences in their spatial distributions. For transitions that are not detected, a 2-σ upper limit is shown by a downward arrow. No heavy ions are found beyond d = Rh, while Lyα continues to be seen to larger distances. Panel (c) displays the ensemble average of gas covering fraction (⟨κ⟩) as a function of absolute r-band magnitude (Mr) for Lyα (black symbols), Mg II (orange), and O VI (purple). Star-forming galaxies (triangles) on average are fainter and exhibit higher covering fractions of hydrogen and chemically enriched gas probed by both low- and high-ionization species than passive galaxies (circles). Measurements of Lyα- and O VI-absorbing gas are based on COS-Halos galaxies for Rgas = Rh. Measurements of Mg II-absorbing gas are based on ≈ 260 star-forming galaxies at z ≈ 0.25 (Chen et al 2010a), and ∼ 38000 passive luminious red galaxies at z ≈ 0.5 (Huang et al 2016) for Rgas = Rh / 3. Panel (d) illustrates the apparent constant nature of mass-normalized radial profiles of CGM absorption since z ≈ 3 (e.g., Chen 2012, Liang and Chen 2014). The high-redshift observations are based on mean C IV absorption in stacked spectra of ∼ 500 starburst galaxies with a mean stellar mass and dispersion of ⟨ log Mstar ⟩ = 9.9 ± 0.5 (Steidel et al 2010), and the low-redshift observations are for ∼ 200 individual galaxies with ⟨ log Mstar ⟩ = 9.7 ± 1.1 and modest SFR (Liang and Chen 2014). |
While Wr is typically found to decline steadily with increasing d for all transitions (e.g., Chen 2012, Werk et al 2014), the scatters are large. Including the possibility that more massive haloes have more spatially extended halo gas, the halo radius Rh-normalized Wr-d distribution indeed displays substantially reduced scatters in the radial profiles shown in panels (a) and (b) of Fig. 6. A reduced scatter in the Rh-normalized Wr-d distribution indicates that galaxy mass plays a dominant role in driving the extent of halo gas. In addition, it also confirms that accurate associations between absorbers and absorbing galaxies have been found for the majority of the systems.
A particularly interesting feature in Fig. 6 is a complete absence of heavy ions beyond d = Rh, while detections of Lyα continue to larger distances. The absence of heavy ions at d > Rh, which is observed for a wide range of ionization states, strongly indicates that chemical enrichment is confined within individual galaxy haloes. This finding applies to both low-mass dwarfs and massive galaxies. However, it should also be noted that heavy ions are observed beyond Rh for galaxies with close neighbours (e.g., Borthakur et al 2013, Johnson et al 2015), suggesting that environmental effects play a role in distributing heavy elements beyond the enriched gaseous haloes of individual galaxies. Comparing panels (a) and (b) of Fig. 6 also shows that within individual galaxy haloes, a global ionization gradient is seen with more highly ionized gas detected at larger distances. For instance, the observed Wr declines to < 0.1 Å at d ≈ 0.5 Rh for C II and Si II, while C IV and O VI absorbers of Wr > 0.1 Å continue to be found beyond 0.5 Rh.
The observed Wr versus d (or d / Rh) based on a blind survey of absorption features in the vicinities of known galaxies also enables measurements of gas covering fraction 3. The mean gas covering fraction (⟨κ⟩) can be measured by a simple accounting of the fraction of galaxies in an annular area displaying associated absorbers with Wr exceeding some detection threshold W0, and uncertainties can be estimated based on a binomial distribution function. Dividing the sample into different projected distance bins, it is clear from Fig. 6a and b that the fraction of non-detections increases with increasing projected distance, resulting in a declining ⟨κ⟩ with increasing d for all transitions observed (see also Chen et al 2010a, Werk et al 2014, Huang et al 2016).
It is also interesting to examine how ⟨κ⟩ depends on galaxy properties. Figure 6c displays ⟨κ⟩ observed within a fiducial gaseous radius Rgas for star-forming (triangles) and passive (circles) galaxies. The measurements are made for Lyα (black symbols), Mg II (orange), and O VI (purple) with a threshold of W0 = 0.1 Å, and shown in relation to the absolute r-band magnitude (Mr). Error bars represent the 68% confidence interval. The absolute r-band magnitude is a direct observable of a galaxy and serves as a proxy for its underlying total stellar mass. Measurements of Lyα- and O VI-absorbing gas are based on COS-Halos galaxies for Rgas = Rh (see also Johnson et al 2015 for a sample compiled from the literature). Measurements of Mg II-absorbing gas are based on ≈ 260 star-forming galaxies at z ≈ 0.25 (Chen et al 2010a, and ∼ 38000 passive luminous red galaxies at z ≈ 0.5 (Huang et al 2016) for Rgas = Rh / 3 (e.g., Chen and Tinker 2008). The larger sample sizes led to better constrained ⟨κ⟩ for Mg II absorbing gas in galactic haloes. In general, star-forming galaxies on average are fainter, less massive, and exhibit a higher covering fraction of chemically enriched gas than passive galaxies (see also Johnson et al 2015). At the same time, the covering fraction of chemically enriched gas is definitely non-zero around massive quiescent galaxies.
Comparing the radial profiles of CGM absorption at different redshifts offers additional insights into the evolution history of the CGM, which in turn helps distinguish between different models for chemical enrichment in galaxy haloes. The radial profiles of the CGM have been found to evolve little since z ∼ 3 (e.g., Chen 2012), even though the star-forming properties in galaxies have evolved significantly. Figure 6d illustrates the apparent constant nature of mass-normalized radial profiles of C IV absorption in galactic haloes (Liang and Chen 2014). The high-redshift observations are based on stacked spectra of ∼ 500 starburst galaxies with a mean stellar mass and dispersion of ⟨ log Mstar ⟩ = 9.9 ± 0.5 (Steidel et al 2010) and a mean SFR of ⟨ SFR ⟩ ≈ 30−60 M⊙ yr−1 (e.g., Erb et al 2006b, Reddy et al 2012). The low-redshift galaxy sample contains individual measurements of ∼ 200 galaxies with ⟨ log Mstar ⟩ = 9.7 ± 1.1 and more quiescent star-forming activities of ⟨ SFR ⟩ ∼ 1 M⊙ yr−1 (Chen 2012, Liang and Chen 2014). The constant mass-normalized CGM radial profiles between galaxies of very different SFR indicate that mass (rather than SFR) is a dominant factor that determines the CGM properties over a cosmic time interval. This is consistent with previous findings that CGM absorption properties depend strongly on galaxy mass but only weakly on SFR (e.g., Chen et al 2010b), but at odds with popular models that attribute metal-line absorbers to starburst-driven outflows (e.g., Steidel et al 2010, Ménard et al 2011).
A discriminating characteristic of starburst-driven outflows is their distinctly non-spherical distribution in galactic haloes in the presence of a well-formed star-forming disk. Specifically, galactic-scale outflows are expected to travel preferentially along the polar axis where the gas experiences the least resistance (e.g., Heckman et al 1990). In contrast, accretion of the IGM is expected to proceed along the disk plane with ≲ 10% covering fraction on the sky (e.g., Faucher-Giguère and Kereš 2011, Fumagalli et al 2011). Such azimuthal dependence of the spatial distribution of infalling and outflowing gas is fully realized in state-of-the-art cosmological zoom-in simulations (e.g., Shen et al 2013, Agertz and Kravtsov 2015). Observations of z ≈ 0.7 galaxies have shown that at d < 50 kpc the mean Mg II absorption equivalent width within 45∘ of the minor axis is twice of the mean value found within 45∘ of the major axis, although such azimuthal dependence is not observed at d > 50 kpc (Bordoloi et al 2011). The observed azimuthal dependence of the mean Mg II absorption strength is qualitatively consistent with the expectation that these heavy ions originate in starburst-driven outflows, and the lack of such azimuthal dependence implies that starburst outflows are confined to the inner halo of d ≲ 50 kpc.
Many subsequent studies have generalized this observed azimuthal dependence at d < 50 kpc to larger distances and attributed absorbers detected near the minor axis to starburst-driven outflows and those found near the major axis to accretion (e.g., Bouché et al 2012, Kacprzak et al 2015). However, a causal connection between the observed absorbing gas and either outflows or accretion remains to be established. While gas metallicity may serve as a discriminator with the expectation of starburst outflows being more metal-enriched relative to the low-density IGM, uncertainties arise due to poorly understood chemical mixing and metal transport (e.g., Tumlinson 2006). Incidentally, a relatively strong Mg II absorber has been found at d ≈ 60 kpc along the minor axis of a starburst galaxy but the metallicity of the absorbing gas is 10 times lower than what is observed in the ISM (Kacprzak et al 2014), highlighting the caveat of applying gas metallicity as the sole parameter for distinguishing between accretion and outflows.
Figure 7 presents visual comparisons of the geometric alignment of galaxy major axis relative to the QSO sightline and the observed CGM absorption strength. The figure at the top displays the observed O VI column density, N(O VI), versus d for COS-Halos galaxies at z ≈ 0.2 (Tumlinson et al 2013). The bottom figure displays comparisons of N(O VI) and N(Mg II) for these galaxies. The absorption-line measurements are adopted from Werk et al (2013). When spatially resolved images are available, the data points are replaced with an image panel of the absorbing galaxy. Each panel is 25 proper kpc on a side, and is oriented such that the QSO sightline falls on the y-axis at the corresponding N(O VI) of the galaxy. The relative alignment between galaxy major axis and the background QSO sightline cannot be determined, if the galaxies are face-on with a minor-to-major axis ratio > 0.7 or if the galaxies display irregular/asymmetric morphologies. These galaxies are labeled “F” and “A”, respectively. For galaxies that clearly display a smooth and elongated morphology, the orietation of the major axis can be accurately measured. Galaxies with the QSO located within 30∘ of the minor axis are labeled 'm', while galaxies with the QSO located within 30∘ of the major axis are labeled 'M'. Galaxies with the QSO sightline occuring intermediate (30∘ − 60∘) between the minor and major axis are labeled “45”. Star-forming galaxies are colour-coded in blue, and passive galaxies in red. Downward arrows indicate 2-σ upper limits for non-detections, while upward arrows indicate saturated absorption lines.
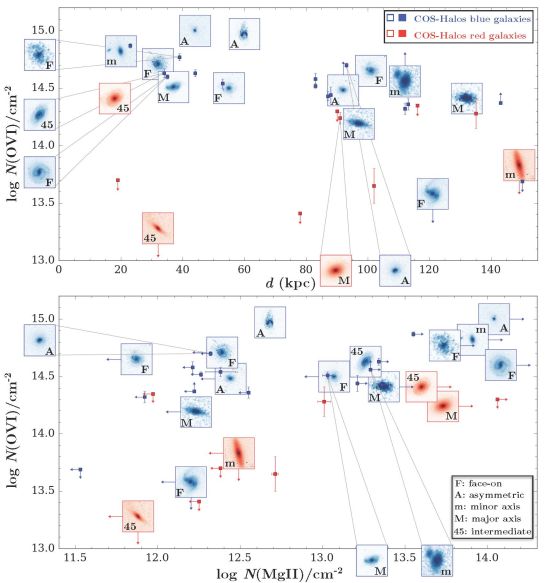 |
Figure 7. Visual comparisons of the geometric alignment of galaxy major axis relative to the QSO sightline and the observed CGM absorption strength (by Rebecca Pierce). Top: Observed O VI column density, N(O VI), versus d for COS-Halos star-forming (in blue) and passive (in red) galaxies (Tumlinson et al 2011). Bottom: Comparisons of N(O VI) and N(Mg II) for the COS-Halos galaxies from Werk et al 2013. When spatially resolved images are available, the data points are replaced with an image panel of the absorbing galaxy. Each panel is 25 proper kpc on a side, and is oriented such that the QSO sightline occurs on the y-axis at the corresponding O VI column density of the galaxy. Disk alignments cannot be determined for face-on galaxies (minor-to-major axis ratio > 0.7) and galaxies displaying irregular/asymmetric morphologies, which are labeled “F” and “A”, respectively. Galaxies with the QSO located within 30∘ of the minor axis are labeled 'm' in the lower-left corner, while galaxies with the QSO located within 30∘ of the major axis are labeled 'M'. Galaxies with the QSO sightline occuring intermediate (30∘−60∘) between the minor and major axis are labeled “45”. Downward arrows indicate 2-σ upper limits for non-detections, while upward arrows indicate saturated absorption lines. The COS-Halos galaxy sample provides a unique opportunity to examine low- and high-ionization halo gas for the same galaxies at once. Galaxies surrounded by O VI and Mg II absorbing gas clearly exhibit a broad range both in morphology and in disk orientation. In addition, the observed N(Mg II) displays a significantly larger scatter than N(O VI). |
While the COS-Halos sample is small, particularly when restricting to those galaxies displaying a smooth, elongated morphology, it provides a unique opportunity to examine low- and high-ionization halo gas for the same galaxies at once. Two interesting features are immediately clear in Fig. 7. First, galaxies surrounded by O VI and Mg II absorbing gas exhibit a broad range both in morphologygalaxy morphology and in star formation history, from compact quiescent galaxies, to regular star-forming disks, and to interacting pairs. The diverse morphologies in O VI and Mg II absorbing galaxies illuminate the challenge and uncertainties in characterizing their relative geometric orientation to the QSO sightline based on azimuthal angle alone. When considering only galaxies with smooth and elongated (minor-to-major axis ratio < 0.7) morphologies, no clear dependence of N(O VI) or N(Mg II) on galaxy orientation is found. Specifically, nine star-forming galaxies displaying strong O VI absorption at d < 80 kpc (log N(O VI)) have spatially resolved images available. Two of these galaxies display disturbed morphologies and four are nearly face-on. The remaining three galaxies have the inclined disks oriented at 0∘, 45∘, and 90∘ each. For passive red galaxies, two have spatially resolved images available and both are elongated and aligned at ≈ 45∘ from the QSO sightline. One displays an associated strong O VI absorber and the other has no corresponding O VI detections. At d > 80 kpc, the morphology distribution is similar to those at smaller distances. No strong dependence is found between the presence or absence of a strong O VI absorber and the galaxy orientation.
In addition, while the observed N(O VI) at d < 100 kpc appears to be more uniformly distributed with a mean and scatter of log N(O VI) = 14.5 ± 0.3 (Tumlinson et al 2011), the observed N(Mg II) displays a significantly larger scatter. Specifically, the face-on galaxy at d ≈ 32 kpc with an associated O VI absorber of log N(O VI) ≈ 14.7 does not have an associated Mg II absorber detected to a limit of log N(Mg II) ≈ 12.4. Two quiescent galaxies at z ≈ 20 and 90 kpc (red panels) exhibit saturated Mg II absorption of log N(Mg II)>13.5 and similarly strong O VI of log N(O VI) ≈ 14.3. A small scatter implies a more uniformly distributed medium, while a large scatter implies a more clumpy nature of the absorbing gas or a larger variation between different galaxy haloes. Such distinct spatial distributions between low- and high-ionization gas further highlight the complex nature of the chemically enriched CGM, which depends on more than the geometric alignment of the galaxies. A three-dimensional model of gas kinematics that takes full advantage of the detailed morphologies and star formation history of the galaxies is expected to offer a deeper understanding of the physical origin of chemically enriched gas in galaxy haloes (e.g., Gauthier and Chen 2012, Chen et al 2014, Diamond-Stanic et al 2016).
2 For comparison, the sizes of extended HVC complexes at d ∼ 10 kpc from the MW disk are a few to 15 kpc across (e.g., Putman et al 2012). HVCs at larger distances are found to be more compact, ≲ 2 kpc (e.g., Westmeier et al 2008, Lockman et al 2012, Giovanelli et al 2013). Back.
3 A blind survey of absorption features around known galaxies differs fundamentally from a blind survey of galaxies around known absorbers (e.g., Kacprzak et al 2008). By design, a blind galaxy survey around known absorbers excludes transparent sightlines and does not provide the sample necessary for measuring the incidence and covering fraction of absorbing species. In addition, because of limited survey depths, a blind galaxy survey is more likely to find more luminous members at larger d that are correlated with the true absorbing galaxies which are fainter and closer to the QSO sightline, resulting in a significantly larger scatter in the Wr versus d distribution (e.g., Kacprzak et al 2008, Nielsen et al 2013). Back.