


This REVISED SHAPLEY-AMES (RSA) Catalog provides a particularly useful sample for statistical studies because the velocity coverage is nearly complete and because the catalog completeness function f (m) is well determined (page 4). The luminosity and density functions of the nearby galaxies can be obtained from the RSA data from calculations of the bias (Sandage, Tammann, and Yahil, 1979; Tammann, Yahil, and Sandage, 1979; Yahil, Sandage, and Tammann, 1980) that start from the apparent distributions of velocities, apparent magnitudes, and absolute magnitudes. Because the distributions are of general interest in themselves, we summarize some of them in this section.
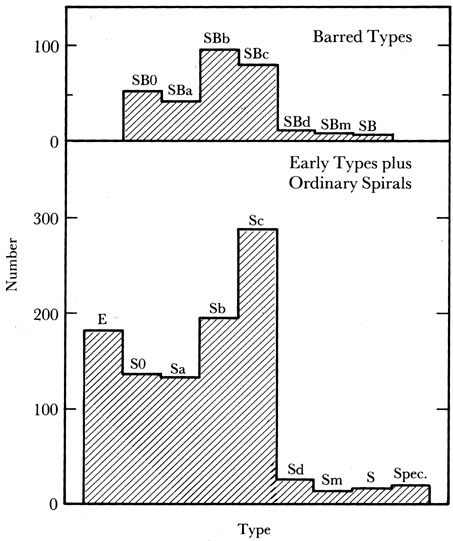
Histograms of the types are given in Figure 1, divided into the ordinary and the barred families. The types in the main catalog have a somewhat finer subdivision than shown in this figure, as we have combined the transition cases (such as E/S0, S0/a, Sab, Sbc) with the main groups. In those cases where the type is in doubt and where two possibilities are given [such as NGC 3390, listed as type S03(8) or (Sb)], the galaxy has been counted twice, once in each bin. Hence the sum of the numbers is greater than the 1246 entries in the catalog.
|
Figure 1. The distribution of types in the complete RSA. Intermediate and transitional types have been combined with the main types in these histograms. |
The distribution of the types is as follows:
| Ordinary | Barred | ||
| E + E/S0 | 173 | SB0 + SB0/SBa | 48 |
| S0 + S0/a | 142 | SBa + SBab | 42 |
| Sa + Sab | 123 | SBb + SBbc | 96 |
| Sb + Sbc | 187 | SBc | 77 |
| Sc | 293 | SBcd + SBd | 8 |
| Scd + Sd | 26 | SBm + IBm | 9 |
| Sm + Im | 13 | SB | 5 |
| S | 16 | ||
| Special | 18 | ||
| 991 | 285 | ||
Note the very few galaxies of types Sd, SBd, and later.This is due entirely to the observational bias in the apparent-magnitude-limited RSA caused by the fainter mean absolute magnitude of these types compared with Sc, SBc, and earlier galaxies. The density of Sd and later types per unit volume of space, in fact, dominates the true distribution (see Tammann et al., 1979).
The distribution of velocities v0, i.e., reduced to the centroid of the Local Group, is shown in Figure 2, binned in 250 km/s intervals. Only nine galaxies of the 1245 listed have negative velocities, and these are either in the Local Group or are within 4° of the center of the Virgo Cluster. The Virgo cases are clearly in the tail of the virial velocity distribution of that cluster.

|
Figure 2. The distribution of reduced velocities v0 in the RSA (n = 1245), binned in 250 km/s intervals. (NGC 7119 with v0 = 9825 km/s is not plotted.) |
This observed distribution diagram contains the information which,
together with the distribution of apparent and absolute magnitudes,
permits the luminosity, completeness, and density functions to be
calculated. The calculation starts by noting that the number of
galaxies with velocity v in the velocity interval
 v that are listed
in the RSA in a particular region of the sky of solid angle
v that are listed
in the RSA in a particular region of the sky of solid angle
 is
is
where H0 is the Hubble constant,
Use of the
Note from Figure 2 the few numbers of RSA
galaxies with v0 > 4000 km
s-1. Hence, the grasp of the catalog is hardly further than ~ 80 Mpc
with any statistical significance.
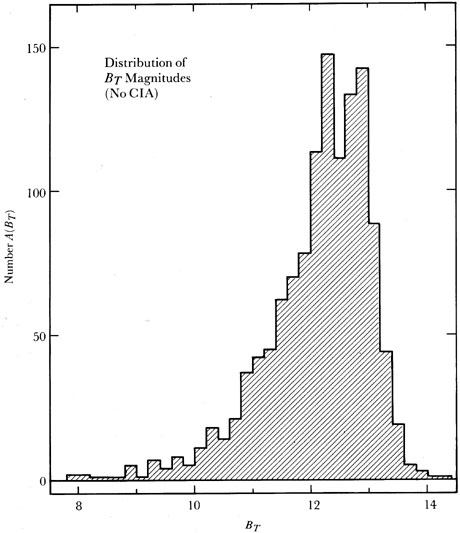
Figure 3 shows the distribution of
BT magnitudes, not corrected for
Galactic absorption (A0 of Column 13) nor for internal
absorption (Ai
of Column 14). A histogram (not shown) of corrected magnitudes
BT0,i is
similar, but is, of course, shifted toward brighter magnitudes. The
expected count per magnitude interval A(BT) can be
calculated from the
fundamental equation of stellar statistics with the adopted
Figure 3. The number of galaxies in the RSA
at magnitude BT (not
corrected for Galactic or internal absorption) in the interval
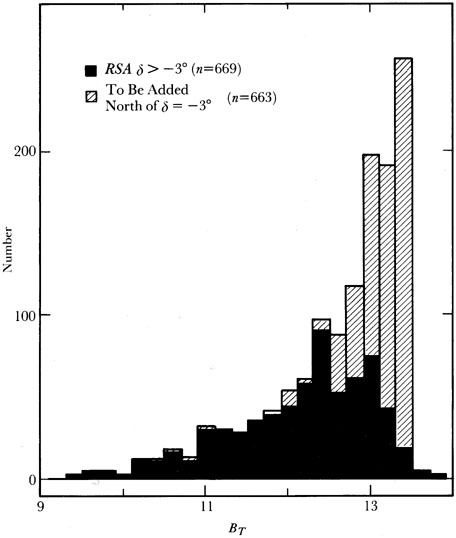
The incompleteness of the RSA is shown in
Figure 4, where the solid
histogram represents counts in the RSA for galaxies with declinations
north of -3°. The hatched histogram is for galaxies from the Table of
Additional Bright Galaxies in Appendix A. These should have been
included in the original Shapley-Ames but were not. The completeness
function f (m) agrees well with the ratio of the hatched to the solid
histograms at any given apparent magnitude.
Figure 4. Illustrates the incompleteness of
the RSA as listed. The solid
histogram is the distribution of apparent BT
magnitudes for all
galaxies in the RSA north of declination -3°. The hatched
additions are the galaxies north of
The incompleteness begins at about BT
For convenience we list the 20 known galaxies that are brighter than
BT = 12m.0 missing from the RSA. The
absolute magnitudes are from
Kraan-Korteweg and Tammann (1979).
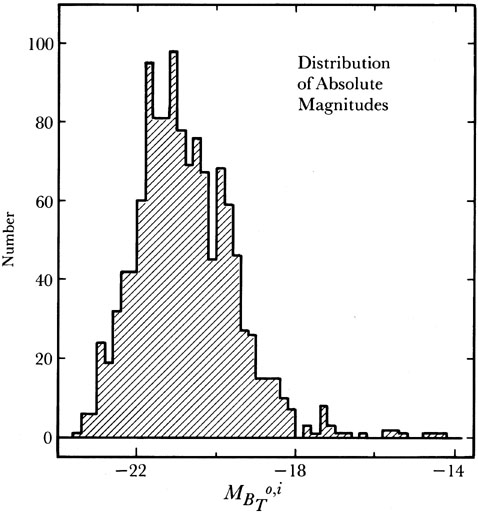
The distribution of absolute magnitudes for all galaxies in the
catalog with redshifts is shown in Figure 5. The
very few galaxies
fainter than MBT0, i = -
18m is a result of the intrinsic bias of the
magnitude-limited catalog. The absolutely fainter galaxies are denied
entry into the listing in appreciable numbers because the apparent
magnitude limit is too bright for distances where the volume becomes
sufficiently large. This natural bias is so severe that the true
differential luminosity function rises monotonically from
MB
Figure 5. The distribution of absolute
luminosities for all galaxies in
the RSA that have redshifts, using maqgnitudes corrected for internal
and Galactic absorption. The true luminosity function (i.e., the
distribution per unit volume) rises monotonically. The fall of the
apparent function fainter than -22 mag is due to the observational bias.
For convenience we list here the 13 RSA galaxies that are brighter
than MBT0, i =
-23m.0 and the 11 galaxies fainter than
MBT0, i = -17m.0.
The comparison of the maximum luminosity of E and spiral galaxies
depends, of course, on the adopted correction for intrinsic
absorption. Without corrections, the brightest spiral is NGC
1961 with
MBT0, i = -
23m.04 which is ~ 0.3 fainter than the brightest elliptical.
 (M) is the differential luminosity
function (i.e., the number of galaxies per unit volume at M per unit
magnitude interval), f (m) the completeness function, and
D(v) = 1
homogeneous case]. A linear velocity-distance relation is assumed, and
the variables are connected by m = M + 5 log v +
16.51, which assumes
a Hubble constant of 50 km/s Mpc.
(M), f
(m), and D(v) functions determined from these data
(Sandage et al., 1979;
Tammann et al., 1979;
Yahil et al., 1980)
reproduces the histogram in Figure 2 by summing
the separate
calculations from this equation, providing that the sky is divided
into coherent regions over which particular values of the density D(v)
have relevance.
(M), f (m),
and density functions. And because these functions were determined
from the reverse analysis of Figures 2 and
3, the agreement of the
prediction with the observed distribution of
Figure 3 is of course good.
(M) is the differential luminosity
function (i.e., the number of galaxies per unit volume at M per unit
magnitude interval), f (m) the completeness function, and
D(v) = 1
homogeneous case]. A linear velocity-distance relation is assumed, and
the variables are connected by m = M + 5 log v +
16.51, which assumes
a Hubble constant of 50 km/s Mpc.
(M), f
(m), and D(v) functions determined from these data
(Sandage et al., 1979;
Tammann et al., 1979;
Yahil et al., 1980)
reproduces the histogram in Figure 2 by summing
the separate
calculations from this equation, providing that the sky is divided
into coherent regions over which particular values of the density D(v)
have relevance.
(M), f (m),
and density functions. And because these functions were determined
from the reverse analysis of Figures 2 and
3, the agreement of the
prediction with the observed distribution of
Figure 3 is of course good.
BT =
0m.2 mag.
 = -3° not listed in the
RSA that are
brighter than BT = 13m.4, found by reducing
the Zwicky Catalogs to the BT system.
= -3° not listed in the
RSA that are
brighter than BT = 13m.4, found by reducing
the Zwicky Catalogs to the BT system.
 12m and becomes
severe by BT
= 12m.5. Surprisingly, however, there are a number of galaxies even
brighter than BT = 12m.0 that should also
have been included. Ten of
these are low-surface-brightness dwarfs (MB
12m and becomes
severe by BT
= 12m.5. Surprisingly, however, there are a number of galaxies even
brighter than BT = 12m.0 that should also
have been included. Ten of
these are low-surface-brightness dwarfs (MB
 - 17m.0). Two
additional
galaxies (IC 342 and the Circinus system) lie at very low Galactic
latitude. This shows the strong bias of the SA against
low-surface-brightness galaxies. The brightest full-sized systems whose
absence in the SA cannot be explained in this way are
NGC 676, NGC 3507, and NGC 660.
- 17m.0). Two
additional
galaxies (IC 342 and the Circinus system) lie at very low Galactic
latitude. This shows the strong bias of the SA against
low-surface-brightness galaxies. The brightest full-sized systems whose
absence in the SA cannot be explained in this way are
NGC 676, NGC 3507, and NGC 660.
Name BT b
MB
Sculptor 9.00 -83 -10.6
Fornax 9.04 -65 -12.0
IC 0342 9.10 +10 -20.7
IC 1613 9.96 -60 -14.8
NGC 0676 10.20 -54
U 7658 10.80 +74 -20.4
Leo I 10.81 +49 -9.6
NGC 3507 11.03 +63
IC 2574 11.03 +43 -17.0
Circinus 11.25 -3 -19.2
Ho II 11.27 +32 -16.7
WLM 11.29 -73 -15.3
NGC 0660 11.62 -47
IC 0520 11.70 +34
IC 0010 11.71 -3 -16.2
NGC 2805 11.78 +40
NGC 2770 11.80 +42
Sextans B 11.89 +43 -15.5
IC 0239 11.93 -19
Sextans A 11.93 +39 -15.2
-23m to at
least -16m, whereas the apparent distribution in
Figure 5 begins to
fall already fainter than
MB
-22m. The method of calculating this
apparent distribution from the luminosity and completeness functions
is given elsewhere
(Sandage, Tammann, and Yahil,
1979).
Name MBT0, i
Type
NGC
1961 -23.68 Sb(rs)II pec
NGC
2832 -23.32 E3
NGC
0772 -23.29 Sb(rs)I
NGC
1275 -23.27 E pec
NGC
3478 -23.27 Sc(s)?
NGC
0309 -23.25 Sc(r)I
NGC
5230 -23.22 Sc(s)I
NGC 7119 -23.21 Sc(s)II
NGC
3646 -23.13 Sbc(r)II
NGC
7184 -23.10 Sab pec
NGC
7469 -23.06 Sbc(s)I.8
NGC
1316 -23.08 Sa pec(merger?)
NGC
0958 -23.03 Sbc(s)II
Name MBT0, i
Type
NGC
0147 -14.36 dE5
NGC
0185 -14.59 dE3 pec
IC
5152 -14.60 SdmIV-V
NGC
6822 -15.25 ImIV-V
NGC
4190 -15.51 SmIV
NGC
0221 -15.53 E2
NGC
0205 -15.72 S0/E5 pec
NGC
4150 -15.73 S03(4)/Sa
NGC
1569 -16.22 SmIV
NGC
2366 -16.73 SBmIV-V
SMC -16.99 ImIV-V