


In the past 5-10 years it has been recognized that a significant fraction of QSOs exhibit BALs and a considerable body of data concerning their properties now exists. Below I briefly review these observations.
2.1. Fraction of QSOs with BALs
Optical discovery programs for QSOs show that at moderate to high redshifts BAL QSOs comprise about 3-10% of the QSO population (Hazard et al. 1984). Since CIV absorption must usually be present to discover a BAL QSO, they are much more difficult to discover at emission redshifts less than about 1.25. Nevertheless, based on observations with IUE or the rare occurrence of MgII BALs, low redshift examples of BAL QSOs have been identified. This work suggests that the fraction of QSOs with BALs at low redshift is not significantly different from the fraction observed at moderate to high redshifts (Turnshek and Grillmair 1986). To stress this point, I show in Figure 1 two low redshift BAL QSOs recently discovered on the basis of MgII BALs during QSO survey work being conducted at the MMT (Foltz et al. 1987b). In this study we report on the discovery of 192 QSOs on four UK Schmidt objective prism plates. This work is part of a much larger survey in which UK Schmidt objective prism plates are digitized with the Automated Plate Measuring machine in Cambridge. Objects brighter than mB = 18.5 are then examined using software algorithms to automatically select QSO candidates. These candidates are observed spectroscopically to confirm their nature. Simulations will be used to consider in detail the question of selection effects in our survey. Such work will eventually lead to a clear determination of the fraction of QSOs with BALs. However, deferring the issue of selection effects to the future, I simply note that of the 192 QSOs initially discovered, two out of 80 QSOs with zem < 1.25 have MgII BALs and probably 8 (but possibly 11) out of 112 QSOs with zem > 1.25 have BALs. Finding two BAL QSOs in a sample of 80 on the basis of MgII BALs was unexpected given the current estimate that MgII BALs are only visible ~ 5 % of the time in BAL QSO spectra.

|
Figure 1. Spectra of 2 new low redshift BAL QSOs discovered in the APM QSO survey. |
At the very highest redshifts (zem > 3) Hazard et al. (1986) suggest that the fraction of QSOs with BALs is notably larger than 3-10%. It has been pointed out that in the well-studied SGP region, 4 of the 24 QSOs known to have zem > 3 are BAL QSOs (Hewett 1987, private communication). In fact, as of this writing, the QSO with the highest known redshift zem = 4.43 is a BAL QSO (Warren et al. 1987).
Finally, in terms of the luminosity dependence of the BAL QSO phenomenon, an examination of 54 low redshift (zem < 1.25) PG QSOs/AGNs in the IUE archives show that 5 of 34 objects with QSO-like luminosities exhibit BALs, while none of 20 objects with Seyfert-like luminosities exhibit BALs (Turnshek and Grillmair 1986).
BAL QSOs exhibit a great deal of variety in absorption characteristics
in terms of
outflow velocity, level of ionization, velocity structure in the
absorption troughs and
strength of the absorption. The BALs often appear detached from the
emission peak,
but usually set in by the time an outflow velocity of 5000-10,000 km
s-1 is reached.
Maximum outflow velocities normally lie in the range 10,000-30,000 km
s-1. Cases
where maximum outflow velocities are lower include RS23
(Turnshek et
al. 1988;
see also Figure 2) and
Q0302+170
(Foltz et al.
1984;
see also Figure 6). Cases where
maximum outflow velocities may be higher include UM141
(Turnshek et
al. 1980)
and Q1414+087
(Foltz et al.
1983;
see also Figure 5). In the latter case a maximum
outflow velocity of ~ 60,000 km s-1 is suggested. Resonance
line transitions due to
CIV, SiIV, NV and OVI are commonly observed in absorption. Some
Ly- absorption
is usually present, but is often weak. Sometimes CIII and AlIII BALs are
observed.
In rare instances, about 5% of the time at moderate redshifts, MgII and CII are
observed. As discussed in posters presented at this workshop, there are
also good
cases of BALs due to resonance line absorption of FeIII or PV, SIV and
SVI (Turnshek et
al. 1987;
see also Figure 13) and AlII and FeII
(Hazard et al.
1987a,
b).
Hazard et al. also report absorption from excited states of FeII
and possibly FeIII. The velocity
structure of the BAL troughs ranges from being very smooth for either
shallow or
deep absorption to very broken-up for either strong or weak
absorption. Sometimes
absorption-absorption line-locking is present and at least for the SiIV
absorption lines
in Q1303+308, has been shown to be statistically
significant, with only about a 1% probability of being due to chance
(Foltz et al.
1987a;
see also Figure 10).
absorption
is usually present, but is often weak. Sometimes CIII and AlIII BALs are
observed.
In rare instances, about 5% of the time at moderate redshifts, MgII and CII are
observed. As discussed in posters presented at this workshop, there are
also good
cases of BALs due to resonance line absorption of FeIII or PV, SIV and
SVI (Turnshek et
al. 1987;
see also Figure 13) and AlII and FeII
(Hazard et al.
1987a,
b).
Hazard et al. also report absorption from excited states of FeII
and possibly FeIII. The velocity
structure of the BAL troughs ranges from being very smooth for either
shallow or
deep absorption to very broken-up for either strong or weak
absorption. Sometimes
absorption-absorption line-locking is present and at least for the SiIV
absorption lines
in Q1303+308, has been shown to be statistically
significant, with only about a 1% probability of being due to chance
(Foltz et al.
1987a;
see also Figure 10).

|
Figure 2. Spectra of 3 QSOs exhibiting relatively narrow broad emission lines with large CIV emission line-to-continuum ratios. Objects which have emission lines exhibiting these characteristics tend to have smooth single trough absorption which sets in very near zero outflow velocity. |
2.3. Correlation Between BAL and Broad Emission Line Profiles
There is some indication that the properties of BAL profiles are
correlated with
the properties of the corresponding broad emission lines. This
possibility is most easily
seen if one parameterizes the CIV broad emission line according to peak
emission
line height to continuum height ratio (line-to-continuum ratio) and FWHM
velocity,
and then examines the BAL profile types that can occur as a function of broad
emission line profile type. In order to illustrate the variety of BAL
profile properties
and demonstrate the possible existence of this correlation, I have
prepared four figures on similar scales, each showing the
Ly- to CIV region in the
QSO rest frame
for three BAL QSOs. BAL QSOs having relatively narrow broad emission lines with
large line-to-continuum ratios are shown in
Figure 2. They have smooth single-trough
absorption which sets in at very near zero outflow velocity. These are
the so-called PHL5200-type BAL QSOs (see
Turnshek et al.
1988).
BAL QSOs having relatively
narrow broad emission lines, but smaller line-to-continuum ratios are
shown in Figure 3. They have multiple trough
absorption which also sets in at very near zero
outflow velocity. BAL QSOs with broader broad emission lines, but still
moderate line-to-continuum ratios are shown in
Figure 4. They have BALs which exhibit some
smoothness, but which are detached from the broad emission line peak,
not setting
in until outflow velocities of 3000-5000 km s-1 are
reached. Finally, BAL QSOs with
the weakest broad emission lines (FWHM hard to measure) are shown in
Figure 5.
They tend to be the ones having BAL profiles with the most
structure. The process
of trying to quantify such a correlation is difficult because so many
parameters are
involved and because good data are sparse. Finally, additional types of
BAL/emission
line profiles do exist, but it is not clear how they may fit into this
suggested correlation.
Hazard et al.
(1984)
and Hartig and Baldwin
(1986)
have suggested other possible correlations.
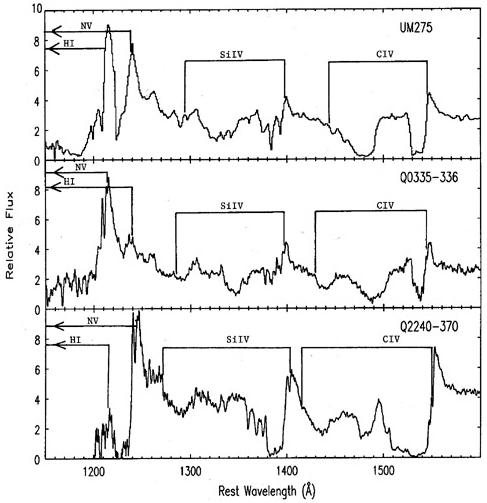
|
Figure 3. Spectra of 3 QSOs exhibiting relatively narrow broad emission lines with moderate strength CIV emission line-to-continuum ratios. Objects which have emission lines exhibiting these characteristics tend to have multiple trough absorption which also sets in very near zero outflow velocity. |
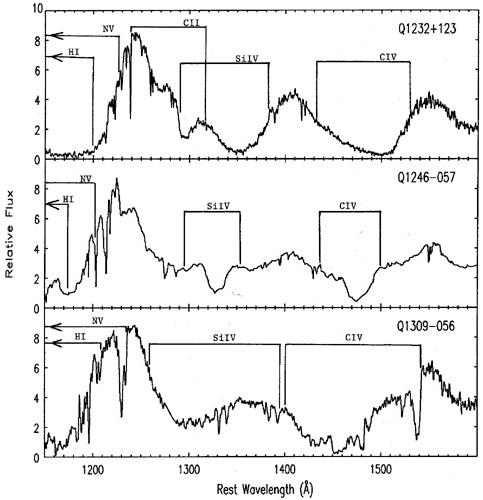
|
Figure 4. Spectra of 3 QSOs exhibiting more extended broad emission lines with moderate strength CIV emission line-to-continuum ratios. Objects which have emission lines exhibiting these characteristics tend to have BALs which show some smoothness, but which are detached from the emission peak, not setting in until outflow velocities of 3000-5000 km s-1 are reached. |
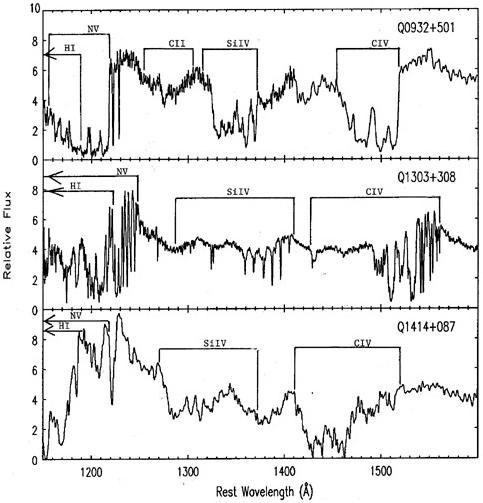
|
Figure 5. Spectra of 3 QSOs exhibiting broad emission lines with very small CIV emission line-to-continuum ratios. The emission line widths are hard to measure accurately in these objects. Objects which have emission lines exhibiting these characteristics tend to have BALs which show the most structure. |
2.4. Emission Line Properties of BAL QSOs
The question of whether the distribution of emission line properties of BAL QSOs are the same as those of non-BAL QSOs is an important one because this tells us something about the BAL/emission line region geometry and the value of the BAL region covering factor for the case where all QSOs are taken to have BAL regions. Selection bias in discovery programs presents a real obstacle to getting a clear picture of the distribution of emission line properties (e.g., see Section 2.1). If the models for the emission line regions and BAL regions of QSOs are spherically symmetric, then given a small BAL region covering factor which is roughly constant, the distribution of emission line properties in BAL QSOs and non-BAL QSOs should be similar. However, there is evidence that, although the range of emission line properties for BAL QSOs and non-BAL QSOs may be similar, the distribution of emission line properties are not. In my opinion, in BAL QSOs as compared with non-BAL QSOs, four effects are fairly clearly established:
See the work of Turnshek (1984b), Hartig and Baldwin (1986), Surdej and Hutsemekers (1987) and Junkkarinen, Burbidge and Smith (1987) for details and concerns. As discussed in Section 3.4, if BAL region covering factors are small and all QSOs have BAL regions, this must imply that the BAL region geometry is non-spherically symmetric.
2.5. Radio Properties of BAL QSOs
Another important issue concerns the radio properties of the BAL QSOs compared to other optically selected QSOs. Stocke et al. (1984) have shown that bonafide BAL QSOs are radio quiet. Multi-frequency observations at radio wavelengths of new BAL QSOs discovered since the Stocke et al. observations and previously known BAL QSOs have confirmed this (P. Coleman 1986, private communication). On the other hand, there are radio-loud QSOs which have an excess of absorption near the emission redshift (Briggs, Turnshek and Wolfe 1984; Morris et al. 1986; Anderson et al. 1987), and the absorption seen in these objects may have some relation to the BALs. I discuss the similarity between this type of absorption and BALs later in Section 4.1. Foltz et al. (1988) discuss the properties of this class of absorption line systems in the paper following this one.
2.6. Optical Polarization and Variability of BAL QSOs
The optical polarization properties and possibly the optical variability properties of BAL QSOs appear to differ markedly from other radio quiet QSOs. If BAL region covering factors are small and all QSOs have BAL regions, this must also imply that BAL region geometry is non-spherically symmetric. I briefly summarize the observations. A broad-band polarization survey of optically selected QSOs has indicated that BAL QSOs have a fairly high probability of exhibiting significant polarization, unlike the situation for non-BAL QSOs (Moore and Stockman 1984; G. Schmidt 1987, private communication). In their survey of 19 BAL QSOs, 5 BAL QSOs exhibit a fairly high optical polarization of 1.5% or more. The 5 objects exhibiting significant polarization are Q0135-400, Q0932+501, Q1246-0578, Q1413+113 and PHL5200. The PHL5200-type BAL QSOs may be the ones that typically have the highest optical polarizations. For one of the objects (PHL5200) spectropolarimetry has been published (Stockman, Angel and Hier 1981).
In view of the fact that radio-loud optically violent variable QSOs exhibit significant optical polarization, a possibly related topic is the question of optical variability of BAL QSOs. A photographic optical variability study of 64 optically selected moderate to high redshift QSOs by Netzer and Sheffer (1983) accidentally included 5 BAL QSOs. On two plates taken 31 years apart, the non-BAL QSOs as a class did not appear to exhibit variability in excess of ~ 0.2 mag rms scatter which was about the precision of the photographic photometry; however, 3 of the BAL QSOs showed evidence for variation at levels of ~ 1.1 mag, ~ 0.8 mag and ~ 0.5 mag. In another study, the BAL QSO 1E 0104.2+3153 discussed by Giola et al. (1986) has varied approximately ~ 0.5 mag between the beginning of 1982 and the beginning of 1984. To study this phenomenon in more detail, my collaborators and I have undertaken a program of photometric monitoring and we have just recently begun to obtain multi-epoch data.
Just recently, three reports have been presented indicating that the strength of the BAL troughs may have changed with time. The study by Foltz et al. (1987a) indicates that the strength of the highest velocity CIV absorption in Q1303+308 may have decreased over a two year period, while Turnshek et al. (1988) suggest that the SiIV absorption trough in Q1413+113 may have increased in strength over a 4 year period. Observations of Q1246-057 over a 2 year period are also reported to show variation in absorption line intensity (Penston and Smith 1988), but these same authors found no convincing evidence for variations in Q1309-056. Confirming observations for all of these cases, preferably coupled with photometric monitoring, need to be obtained. Junkkarinen, Burbidge and Smith (1983) report that the strength of the absorption in PHL5200 has not changed over a 6 year period. Also, there is no evidence for outflow velocity variations in BAL QSOs (e.g., Junkkarinen, Burbidge and Smith 1983; Foltz et al. 1987a). In general, studies of the possibility of BAL trough intensity and outflow velocity variability are rare.
In concluding my brief review of the observations, I summarize the important results on imaging of low redshift BAL QSOs. Three low redshift BAL QSOs have so far been imaged and have been shown to be extended. Hickson and Hutchings (1987) barely resolved the image of the zem = 0.29 BAL QSO Q1700+518. Recently, I have obtained a limited amount of data in collaboration with Burrows, Hutching and Weymann on the zem = 0.13 BAL QSO Q1416-129 and this object is also resolved. In both cases the images are rather circular, inconsistent with the presumed host galaxy being edge-on or nearly edge-on. The data for the zem = 0.089 BAL QSO Q1411+442 are much better. Accurate images taken by Malkan, Green and Hutchings (1987) show this BAL QSO's host galaxy to be a large spiral with a very long arm or tail which has an inclination angle of 57°. The IUE spectrum shows Q1411+442 to be a BAL QSO of the PHL5200 type, being very similar spectroscopically to RS23 and Q0302+170. These observations have implications for aspect angle effects and the nature of the BAL region geometry.