


Whether the numerous "field" galaxies form a single population has been a long-standing question. Photographic surveys to a surface brightness of 26 magnitude arcsec-2 showed as many as 17,000 faint galaxies per square degree at 24th magnitude (Jarvis & Tyson 1981; Kron 1982). However, photographic surveys of galaxies suffer from a selection bias due to the achievable limiting surface brightness for small objects occupying less than a few square arcseconds. Galaxies, particularly at high redshift, have peak surface brightness which can approach the plate limit, Figure 1 shows the effect on the apparent redshift distribution of introducing such a limit in a mild evolution model. The number of galaxies found at high redshift is reduced by the surface brightness cut typical of photographic limit plates, along with whatever angular diameter threshold is used for object detection. Seeing reduces central surface brightness and can move an object below the surface brightness or angular diameter thresholds. Slit spectrographs impose their own diameter limits.

|
Figure 1. The effect of a surface brightness limit is shown in a model number-redshift plot. A Bruzual model with mild luminosity evolution is run with surface brightness cuts at 26 B mag arcsec-2 [appropriate for photographic surveys] and at 29th mag arcsec-2 [typical of 3-4 hour CCD imaging]. The selection effects on a redshift survey which uses photographically identified galaxies combine this selection with that of the spectrograph. |
Deep CCD imaging survey of 7000 faint galaxies were carried out in 12 random high galactic latitude fields (140 arcmin2 area) to 29 Bj, 28 R, and 26 I mag arcsec-2 limiting surface brightness (Tyson 1988; Tyson & Seitzer 1988), and in a survey of 100 galaxies as deep in B, V and I in three 1.3 arcmin2 fields (Lilly et al. 1991). Ultra-deep CCD imaging to 30 mag arcsec-2 has been obtained in three fields (Guhathakurta et al. 1990), and a large area CCD survey is now under way. This involves as many as 100 disregistered exposures of one field in a given filter. This 3-d stack of disregistered exposures contains all the information about the systematic errors in the CCD, telescope and sky, and the true object luminosity distribution, in separable form. Data processing (see Tyson 1990) produces a catalog of object multi-band photometric data. There are over 200,000 FBGs per square degree in a one magnitude bin at 27th B magnitude. Figure 2 shows a monochrome image of part of one of the old CCD survey fields, 3 arcminutes across.

|
Figure 2. Part of a deep image of a high latitude survey field. This part of the field measures 3 arcmin across. This field is blank on a Schmidt survey plate. |
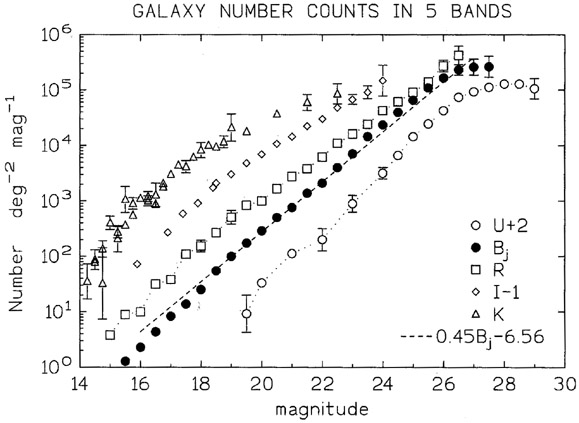
Between 20 and 26 B magnitude the average number of galaxies per magnitude per square degree is given approximately by Log N = 0.45Bj - 6.55, where the blue Bj passband (close to the photographic IIIaJ+GG385 passband) is effectively 3700-5100 Å (Gullixson et al. 1993). However, for Bj magnitudes fainter than 23 the N(Bj) data and models show significant departures from this simple relation.
Figure 3 summarizes faint galaxy count data for five wavelength bands. The U counts are from Guhathakurta et al. 1990, Majewski 1993, and Koo 1986; the Bj, R, and I counts are from our most recent data on 15 fields; and the K counts are from Gardner et al. 1993. The N(m) counts in the Bj band have average slope 0.45. Note that this slope of 0.45 is super-critical in the sense that the contribution to the EBL is monotonically increasing with magnitude. The N(m) slope in the U-band is even steeper. The slope of the N(m) counts for longer wavelengths is sub-critical, going to a "no-evolution" slope of 0.3 at 0.9 µm wavelength. While all counts have been corrected for lost area due to objects, only the Bj, R, and I counts have had full Monte Carlo recovery efficiency corrections applied. Only the U counts at the last three points require this additional correction. We estimate this to be upward by dex 0.2.
The enhancement of the blue and U band counts is apparently coming from objects which are UV-bright in their rest frame. Tinsley (1980) was the first to point out that a high star formation rate at a given epoch would produce a bump in the number-magnitude counts. The small but highly significant bump seen in the blue counts around 25 Bj mag, and more prominently in the U counts, is possibly an effect of this kind. A more accurate representation of the blue counts over the range 15-27 Bj mag, averaged over the survey fields, is given by the following relation:
| (1) |
|
where N has units of deg-2 mag-1. Equation 1 follows the data from relatively local galaxies at 15th magnitude with Euclidean log N - mag slope of 0.6 to the beginning of the turn-over at Bj 26-27 mag. The error bars at the faint end for the average counts arise primarily from statistical fluctuations in the crowding correction Monte Carlo simulations which were performed on the real data images. Fluctuations in galaxy number count from field to field in CCD surveys are inversely correlated with limiting magnitude because of Poisson noise in the bright count statistics and because some brighter galaxies are more clustered on the sky. These field-to-field fluctuations range from 50% at 20th mag to 10% at 27th mag. Finally, for most of the bands the data at the bright end are a mix of CCD and various photographic surveys with correspondingly disparate error bars as a function of magnitude. At a surface brightness of 29 B magnitude arcsec-2, the sky is about 15% covered with FBGs. The number counts rise less steeply with magnitude at longer wavelengths, with the slope of the log number-magnitude relation decreasing from 0.5 at 0.4 µm wavelength, to 0.3 at 0.9 µm, to less than 0.28 at 2.2 µm.
I have resisted the temptation to draw families of lines in
Figure 3 corresponding
to various evolution and no-evolution models, since they show wide
scatter at the faint
end. As discussed below, there are examples of both kinds of models
which can be made
to agree with the faint counts in several bands; the details of the
model SFR, luminosity
functions, and selection effects dominate cosmology. However, one robust
property of
the counts in the blue band is that they exceed simple no-evolution
models using a locally normalized Schechter luminosity function for a
( ,
,
 ) = (1,0) cosmology by as
much as a factor of ten at the faint end. The longer look-back times and
larger volumes
in open cosmologies make it relatively easy to build models with larger
numbers of faint galaxies.
) = (1,0) cosmology by as
much as a factor of ten at the faint end. The longer look-back times and
larger volumes
in open cosmologies make it relatively easy to build models with larger
numbers of faint galaxies.
|
Figure 3. Faint galaxy differential number counts dN(m) as a function of magnitude in five color bands are plotted to their completeness limits. Data are from a number of surveys (see text). Note the decrease in slope d log N/dm with wavelength of the faint part of the number counts. The bump in the counts at the faint end becomes more pronounced at short wavelengths. |
The factor of two increase in Log N - magnitude slope from red to blue wavelengths translates into a blue trend at faint magnitudes. Indeed, even 2.2 µm-selected faint galaxies have extreme blue Bj-R colors (Cowie et al. 1991). There was some evidence of a bluing trend from 18 to 22 B mag for field galaxies in the photographic work of Kron (1980, 1982). This trend continues to fainter magnitudes; the deep multi-band CCD surveys detect a twenty fold increase in surface number density and have much higher photometric precision than plates. While the mean Bj-R color of zero redshift galaxies is about 1.5-2 mag at 21 Bj mag, many FBGs at 26-28 Bj mag have Bj - R < -0.2. The 1.5 mag of bluing in B-R of these FBGs to 27 B magnitude is shown in Figure 4 (see also Tyson 1988; Guhathakurta 1989). Some of these galaxies are as blue as O stars. Color-magnitude plots of stars and galaxies for wide fields show the FBGs going bluer than the stellar blue subdwarf limit in the Galaxy. In the context of stellar evolution these extreme blue colors are usually taken as evidence that one is seeing starburst galaxies at redshifts of 1-2, so that the UV excess is redshifted into the Bj passband. Unfortunately, there are insufficient data on starburst galaxy UV spectral energy distributions shortward of 1500 Å to construct reliable models for high z.

|
Figure 4. Galaxy Bj-R color vs total R magnitude (Guhathakurta et al. 1990). Identical isophotes, determined from the sum image, were used in the two bands in order to avoid systematics. The bluing trend continues to the completeness limit. |