


Providing the observations go to sufficiently faint surface brightness to catch most of the light from these objects, the EBL from all discrete objects can be calculated directly from the galaxy count data by summing flux x count products. Deep imaging in several wavelength bands can be used in this way to construct a rough spectral distribution for this EBL. Since discrete objects are detected, one is not sensitive to any uniform diffuse component in the EBL, so that the EBL one derives by adding up flux of discrete objects must be considered a lower limit if there were a smooth extragalactic visible uniform on greater than 1 arcminute scales.
4.1 EBL From Integral Flux Counts
Galaxy counts vs. isophotal magnitude may be used to calculate directly
the EBL,
down to the surface brightness threshold for detection. The CCD data
covering the
range 0.3-1 µm can be used to calculate the EBL down to 30
Bj mag arcsec-2. The
observed counts flatten fainter than 27 Bj mag, with
most of the EBL flux originating
from galaxies around 24 B mag. Integrating the flux times the
differential number
counts, including the uncertainties at the faint end of the counts, we
arrive at the
following EBL at five wavelengths covering the octave
 = 3200-24000 Å:
| (2) |
In the blue this is 30 times the surface flux threshold of these observations and is equivalent to a diffuse EBL of 0.53(+.02 - .01) S10,G2V(V). The flattening of the N(m) counts originally seen in the Bj band have been seen now more prominently in the U band, and thus represents the outer shell of magnitude contributing significantly to the EBL. Very faint diffuse objects larger than 30 arcsec are not counted in the EBL sum in equation 2, and wide-area searches for nearby examples of such low surface brightness galaxies will be worthwhile (Dalcanton 1994). Given that flattened profile low surface brightness galaxies with radial scales larger than 6 arcseconds comprise less than a few percent of the observed number counts in the magnitude range 23-27 B mag, additional EBL from these low surface brightness galaxies appears to be negligible.
Galaxies fainter than 20 Bj mag contribute about 75 percent of the EBL at 4500 Å. The redshift shell which dominates the EBL is dependent on the galaxy luminosity evolution L*(z). The corresponding magnitude shell contributing most to the EBL at 4500 Å is that magnitude beyond which the slope dN / dm drops below 0.4: 26 Bj mag. From what little we know of the redshifts of these galaxies, the outer redshift shell contributing to the EBL ranges over redshifts 1-3. Interestingly, the Bj-R color of K-selected faint galaxies is very blue and indistinguishable from the FBGs; no population of K-bright galaxies was found, suggesting that starburst activity takes place mainly at redshifts less than 5. A starburst phase at redshift greater than 20 would not be excluded, however. Due to the shallow number-magnitude slope in the K band, most of the 2 µm EBL is contributed by 16-18 K magnitude galaxies at comparatively low redshift. Thus, the nature of the FBGs at 2 µm is separated from the issue of the EBL at long wavelengths; the B-K color of the EBL is unrelated to the colors of the FBGs. Some galaxies at K band have low surface brightness and small scale lengths, and these may be the FBGs. The K band surveys do not yet go faint enough to adequately sample the 27th B magnitude FBGs. Thus, the Bj-K color of the EBL can be redder than the color of a typical FBG because giant stars in bright galaxies contribute so heavily to the K luminosity. The Bj-R color of the FBGs is near zero, like O stars, so that most of their energy in the 0.3-2 µm region is in the blue.
4.2 Spectral Distribution in the Optical
The spectrum of the EBL is related to the integrated star formation
rates in galaxies
over all relevant redshifts, including K-correction. As such, it can be
a diagnostic of
galaxy formation scenarios. The U, Bj, R, and I
surface flux integrals for the EBL are
plotted in Figure 12 vs. wavelength. Note the
short wavelength rise. The error bars
on the EBL flux are 3 , and are
mostly due to field-to-field fluctuations in numbers
of bright galaxies. The spectral distribution of the optical EBL is
slightly redder than
flat in F
, and are
mostly due to field-to-field fluctuations in numbers
of bright galaxies. The spectral distribution of the optical EBL is
slightly redder than
flat in F (see
Guhathakurta et
al. 1990).
This SED is more UV-bright than nearby
galaxies and is probably due to star formation at redshifts up to 2-3 in
the FBGs. A theoretical prediction by
Guiderdoni &
Rocca-Volmerange (1990),
for two cosmologies and different luminosity evolution is shown in
Figure 12 as dashed and
dotted lines.
This large formation redshift model EBL is not very different from
previous models by
Yoshii & Takahara (1988)
and Partridge &
Peebles (1967).
Extending continuous
galaxy formation down to smaller redshift would have the effect of
raising the blue flux, more in agreement with the data.
(see
Guhathakurta et
al. 1990).
This SED is more UV-bright than nearby
galaxies and is probably due to star formation at redshifts up to 2-3 in
the FBGs. A theoretical prediction by
Guiderdoni &
Rocca-Volmerange (1990),
for two cosmologies and different luminosity evolution is shown in
Figure 12 as dashed and
dotted lines.
This large formation redshift model EBL is not very different from
previous models by
Yoshii & Takahara (1988)
and Partridge &
Peebles (1967).
Extending continuous
galaxy formation down to smaller redshift would have the effect of
raising the blue flux, more in agreement with the data.

|
Figure 12. The sum extragalactic background
flux from the faint galaxy population as
a function of wavelength from 1600 Å to 22000 Å. The error
bars are 3 |
Note that the diffuse component of the EBL must be a small fraction of this discrete component, since the 10-300 arcsec upper limit for large diffuse sources at 2.2 µm (Boughn et al. 1984) is only slightly above the measured EBL from discrete sources.
A review of non-imaging EBL surveys in the UV was given by
Paresce & Jakobsen
(1980).
Many models for the FBGs predict a source spectrum rising in the UV to
Lyman- . More sensitive UV and
near-UV surveys could determine if the galaxy counts
at a given flux level are significantly below that seen at 3200-4500
Å, as might be
expected in these models due to the redshifted Lyman continuum. If
spiral formation
continues to redshifts near one, then the new UV sensitive CCDs could be
used to detect
the bright galaxies expected in the 2400-3000 Å band from an
orbiting telescope. The
Hubble Space Telescope, if repaired, might detect the bright nuclei of
some of these
blue galaxies. Galaxies fainter than 24 B mag contribute about 30% of
the EBL in
the blue. Since the redshift of this faint population is mainly larger
than 0.7, their
expected contribution to 10 arcsec scale fluctuations of the EBL would
be negligible for
wavelengths shorter than 1700 Å if these galaxies are "black" in
their Lyman continuum.
Sasseen et al. (1994)
have recently improved on the measurement by
Martin & Bowyer (1988)
at 1600 Å: < 50 photon cm-2 sec-1
sr-1. This corresponds to a flux of
< 6 x 10⁻¹⁰ erg cm-2 sec-1
Å-1 sr-1, or < 1 nW m-2
sr-1. This upper limit is
plotted along with the optical-IR data in
Figure 12. A testable prediction of luminosity
evolution models is a strong UV excess for low redshift galaxies
undergoing starburst.
It would be useful to have this direct imaging UV observational test;
these galaxies
should be visible in a sensitive UV imager with sub-arcsecond resolution.
. More sensitive UV and
near-UV surveys could determine if the galaxy counts
at a given flux level are significantly below that seen at 3200-4500
Å, as might be
expected in these models due to the redshifted Lyman continuum. If
spiral formation
continues to redshifts near one, then the new UV sensitive CCDs could be
used to detect
the bright galaxies expected in the 2400-3000 Å band from an
orbiting telescope. The
Hubble Space Telescope, if repaired, might detect the bright nuclei of
some of these
blue galaxies. Galaxies fainter than 24 B mag contribute about 30% of
the EBL in
the blue. Since the redshift of this faint population is mainly larger
than 0.7, their
expected contribution to 10 arcsec scale fluctuations of the EBL would
be negligible for
wavelengths shorter than 1700 Å if these galaxies are "black" in
their Lyman continuum.
Sasseen et al. (1994)
have recently improved on the measurement by
Martin & Bowyer (1988)
at 1600 Å: < 50 photon cm-2 sec-1
sr-1. This corresponds to a flux of
< 6 x 10⁻¹⁰ erg cm-2 sec-1
Å-1 sr-1, or < 1 nW m-2
sr-1. This upper limit is
plotted along with the optical-IR data in
Figure 12. A testable prediction of luminosity
evolution models is a strong UV excess for low redshift galaxies
undergoing starburst.
It would be useful to have this direct imaging UV observational test;
these galaxies
should be visible in a sensitive UV imager with sub-arcsecond resolution.
The faint galaxy counts in 15 randomly chosen high galactic latitude
fields and 33
other fields are isotropic on the angular scales between fields (10-180
degrees) to about
10% (2). Since these galaxies
are at redshifts of order 1 and above, the galaxies in
different fields are out of causal communication (reminiscent of the
cosmic microwave
background). On angular scales smaller than 30 arcsec we find occasional
voids in each
of the survey fields. These "dark lanes" are probably not intergalactic
dust clouds (with implications for
 baryon) but rather
open channels in the 3-dimensional galaxy distribution.
baryon) but rather
open channels in the 3-dimensional galaxy distribution.
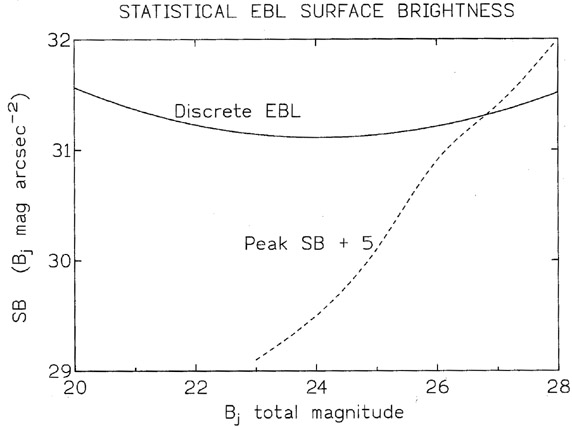
Even with mild luminosity evolution the surface brightness of galaxies at z > 1 is expected to be considerably fainter than nearby galaxies. For example, in 1 arcsec seeing an Sb galaxy at a redshift of 1.5 is expected to have an apparent central surface brightness fainter than 27 Bj mag arcsec-2, falling by one mag at a radius of one arcsec, and reaching 30 Bj mag arcsec-2 at 2 arcsec. The total EBL from discrete objects is equivalent to a diffuse surface brightness of 28.8 Bj mag arcsec-2. However it is instructive to plot the diffuse surface brightness of FBGs, binned by magnitude, as a function of magnitude. Figure 13 shows this surface brightness in the Bj band for the light from FBGs averaged over the sky, in one magnitude bins (solid line).
|
Figure 13. The summed FBG extragalactic background surface brightness in the Bj band (in 1 mag bins), along with the average seeing-deconvolved peak surface brightness of the FBGs, is plotted vs. magnitude. |
This EBL surface brightness is calculated from the observed magnitude and differential number counts. Also shown is the seeing deconvolved central surface brightness of FBGs vs. magnitude, obtained from the deconvolved mean scale length and magnitude (dashed line). A cautionary note: the deconvolved scale lengths exhibit wide scatter, and we would expect the same for the peak surface brightness. Also, the dashed curve in Figure 13 is the extrapolated central surface brightness not including any bulge (see Bosma & Freeman 1993). The curves in Figure 13 imply that if there is a confusion limit it is at fainter surface brightness than 30 Bj mag arcsec-2, although some galaxies in the deepest images have overlapping outer isophotes. Recently, we have examined a field in which 20 hours of cumulative exposures were obtained. Most of the galaxies appear resolved in 1.1 arcsec FWHM seeing, many with average surface brightness of 28 Bj mag arcsec-2 inside a 30 Bj mag arcsec-2 isophote.