


3.2. The main physical processes in BBN
At early times, weak reactions keep the n/p ratio close to the
equilibrium Boltzmann ratio.
As the temperature, T, drops, n/p decreases.
The n/p ratio is fixed (``frozen in'') at a value of about 1/6
after the weak reaction rate is slower
than the expansion rate. This is at about 1 second, when T
 1MeV.
The starting reaction n+p
1MeV.
The starting reaction n+p
 D +
D +
 makes D.
At that time photodissociation of D is rapid because of the high entropy
(low
makes D.
At that time photodissociation of D is rapid because of the high entropy
(low  ) and this
prevents significant
abundances of nuclei until, at 100 sec., the temperature has dropped
to 0.1 MeV, well below the binding energies of the light nuclei.
About 20% of free neutrons decay prior to being incorporated into nuclei.
The 4He abundance is then given approximately by assuming
that all remaining neutrons are incorporated into 4He.
) and this
prevents significant
abundances of nuclei until, at 100 sec., the temperature has dropped
to 0.1 MeV, well below the binding energies of the light nuclei.
About 20% of free neutrons decay prior to being incorporated into nuclei.
The 4He abundance is then given approximately by assuming
that all remaining neutrons are incorporated into 4He.
The change in the abundances over time for one
value is shown in
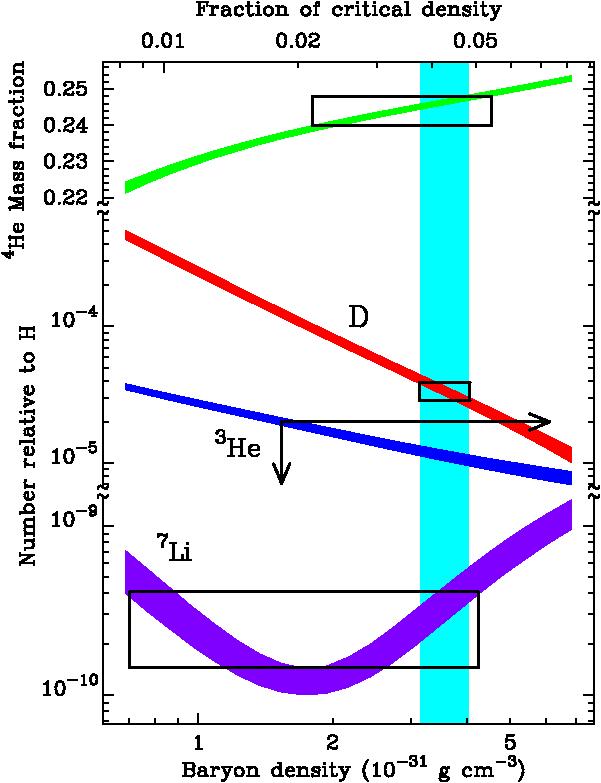
Figure 1, while the dependence of the final
abundances on is
shown in Figure 2, together with
some recent measurements.

|
Figure 1. Mass fraction of nuclei as a
function of temperature
for |
In general, abundances are given by two cosmological parameters,
the expansion rate and
. Comparison with
the strength of the
weak reactions gives the n/p ratio, which determines Yp .
Yp is relatively independent of
because n/p depends on
weak reactions between nucleons and leptons (not pairs of nucleons),
and temperature.
If is larger, nucleosynthesis starts earlier, more nucleons
end up in 4He , and Yp increases slightly. D and
3He
decrease simultaneously in compensation.
Two channels contribute to the abundance of 7Li in the
range of
interest, giving the same 7Li for two values of
.
|
Figure 2. Abundances expected for the light
nuclei 4He, D, 3He and
7Li (top to bottom) calculated in standard BBN. New
estimates of the
nuclear cross-section errors from Burles et al. (1999a) and Nollet &
Burles (1999) were used to
estimate the 95% confidence intervals which are shown by the vertical widths
of the abundance predictions. The horizontal scale,
|