


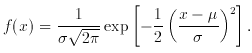
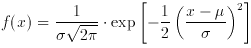
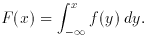
for which the density function is
Fig. 1 shows the well-known appearance of this
function, and of its
integral, the corresponding distribution function. Both functions are
tabulated in Table II. Because
of the choice of symbols, the mean = µ
the variance =
Fig. 1. The Normal distribution. The
probability density function (solid curve) is
and the distribution function (dotted curve) is
50 per cent of the area lies between ± pe (probable error). See
Tables II and
III.
Let us draw a sample of N xis from a population
of xs which we believe
to be Normally distributed - the basis for such a belief can wait for a
paragraph or so. How do we estimate the population mean µ
and variance
which differs from the definition of
where the weights are given by
the reciprocals of the sample variances. The best estimate of the
variance of
But to return to the Normal distribution itself; why is it Magic? Why
might we expect populations, data sets, measurements, etc., to be so
arranged? We know from experience that they frequently are. One obvious
reason for the prominence of the Normal distribution is that two
distributions frequently encountered in Nature, namely the Binomial and
Poisson (see Table I), each tend to it
in their respective limits n ->
The Central Limit Theorem: Suppose that independent random variables
Xi
of UNKOWN probability density function are identically distributed with
mean µ and variance
The tendency of the Binomial and Poisson distributions to the Normal is
simply a particular instance of the operation of this miraculous
theorem. Indeed, the theorem applies to both discrete and continuously
distributed variables, and under certain weak conditions it is even
possible to relax the requirements of independence and of identical
distribution for the Xi; Normal distributions for
means (and even for
other linear combinations of the variables) still result.
The Central Limit Theorem thus allows quantitative probabilities to be
extimated in experimental situations where the form of the underlying
probability distribution is unknown. In particular, the individual
members of many data sets which we acquire are the result of some kind
of averaging - even ``eyeball integration'' Counts! - and in such
circumstances the Central Limit Theorem says that the data tend to a
Normal distribution. As a result, we can (and do) estimate population
parameters µ and
But the Central Limit Theorem cannot always yield us a Normal
distribution, as we shall see in discussing signal detection. Indeed,
there is a caveat before we get there. Because of the prominence of the
Normal distribution it does provide a useful way of describing errors,
dispersions, or differences, which is intuitively very acceptable. We
use the Normal distribution for this purpose by quoting errors or
differences in terms of the standard deviation, which for a Normal
distribution is the root-mean-square deviation ``corrected'' by the factor
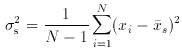
Fig. 2. A histogram of differences
between two fictitious sets of
right ascension measurements. The dashed curve is the Normal curve
``describing'' the distribution on the basis of a straightforward
calculation of
In this latter respect, beware of probable error. This is the
±
 2,
and the standard deviation = .
2,
and the standard deviation = .

 2 ? Not
necessarily by applying the definitions of
Section 2 to our
bunch of xis, because these may not result in unbiased
estimates. In fact, it may be shown (e.g.
(4)) that for a
Normally-distributed
population,
2 ? Not
necessarily by applying the definitions of
Section 2 to our
bunch of xis, because these may not result in unbiased
estimates. In fact, it may be shown (e.g.
(4)) that for a
Normally-distributed
population,  s, the arithmetic mean of the sample, is indeed
an unbiased
estimate of µ, but the unbiased estimate of 2 is
s, the arithmetic mean of the sample, is indeed
an unbiased
estimate of µ, but the unbiased estimate of 2 is
 2 given earlier by the factor
(N / (N - 1)). This factor can give rise to confusion:
s2 is usually
referred to as the sample variance, while the 2 defined in
Section 2 is
called the population variance, and, of course, s2 -> 2 as N ->
2 given earlier by the factor
(N / (N - 1)). This factor can give rise to confusion:
s2 is usually
referred to as the sample variance, while the 2 defined in
Section 2 is
called the population variance, and, of course, s2 -> 2 as N ->  .
(That there should be a difference is easy to understand: the
xi of our
sample are first used to get s, an estimate of µ, and although this is
an unbiased estimate of µ it is the estimate which yields a
minimum
value for the sum of the squares of the deviations of the sample, and
thus a low estimate of the variance. The theory provides the appropriate
correction factor, namely N / (N - 1).) The standard
deviation (error) on s, our estimate of µ, is s /
.
(That there should be a difference is easy to understand: the
xi of our
sample are first used to get s, an estimate of µ, and although this is
an unbiased estimate of µ it is the estimate which yields a
minimum
value for the sum of the squares of the deviations of the sample, and
thus a low estimate of the variance. The theory provides the appropriate
correction factor, namely N / (N - 1).) The standard
deviation (error) on s, our estimate of µ, is s /  N. Moreover, if we have
n estimates of µ,
namely j, each
having an associated error j, the best estimate of µ is
the weighted mean, i.e.
N. Moreover, if we have
n estimates of µ,
namely j, each
having an associated error j, the best estimate of µ is
the weighted mean, i.e.

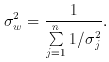
 w is
w is
 and µ -> . But the
real answer lies in what is perhaps the most
important theorem in Statistical Inference, Measurement Theory, and
Experimental Design, namely
(1),
(4),
2 (both finite). Take a sample of n of these
variables; as n becomes large, the distribution of the mean
and µ -> . But the
real answer lies in what is perhaps the most
important theorem in Statistical Inference, Measurement Theory, and
Experimental Design, namely
(1),
(4),
2 (both finite). Take a sample of n of these
variables; as n becomes large, the distribution of the mean  of the
sample tends to a Normal distribution with mean µ, while the sample
variance tends to 2
/ n.
2 from single samples, or from combining the results
from different samples, in the manner described above, happy in the
thought that the Central Limit Theorem has (probably) justified the
procedure. For example, we may wish to determine an intensity from
several measurements of it; the best estimate is then s ± s as given
above. Alternatively, given several independent estimates of the
intensity, j ± j, the best overall estimate
(2) is w ± w, as above.
[N / (N - 1)]; for
the Normal distribution, the region ( - ) < x <
( + )
contains 68.3 per cent of the area, i.e. 68.3 per cent of the ``expected
results''. The caveat is that the Normal distribution has very short
tails - it dies rapidly beyond ± 2, as Fig. 1 shows. Consider, for
example, the comparison of two independent sets of (fictitious) right
ascension measurements as shown in Fig. 2. If
the differences were
Normally distributed, a valid procedure is to calculate their mean to
determine the systematic difference, and then 2diff, the
sample variance, = (N / (N - 1)) times the
mean-square deviation. Suppose that 12 and 22 are the variances known
for each of the two independent sets of right ascension; then the
expected variance in the differences (see, e.g.
(9)) is 12 + 22, and
the computed 2diff may be compared with this,
perhaps to verify the
estimates of the individual variances. However,
Fig. 2 shows a few wild
differences, of the type which inevitably seem to occur in comparisons
of this sort, and which extend the tails far beyond those of a Normal
distribution. (Such differences may arise from computational blunders or
from some disturbance of the underlying probability distributions; see
Section 4.) Moreover, note what happens if we
compute our estimates of
mean and variance as for Normal distributions - these quantities are
completely dominated by the wayward values, and the Normal distribution
which they imply (the dashed curve) fits the data very poorly. But we
can still describe these in terms of a Normal distribution if we are
careful. One way is to reject the large and offensive values from our
(µ, ) estimates;
but this may not be possible, and is undoubtedly
dangerous. A safer method is to use the median as a location measure,
and to adopt as a dispersion measure the ±
of the
sample tends to a Normal distribution with mean µ, while the sample
variance tends to 2
/ n.
2 from single samples, or from combining the results
from different samples, in the manner described above, happy in the
thought that the Central Limit Theorem has (probably) justified the
procedure. For example, we may wish to determine an intensity from
several measurements of it; the best estimate is then s ± s as given
above. Alternatively, given several independent estimates of the
intensity, j ± j, the best overall estimate
(2) is w ± w, as above.
[N / (N - 1)]; for
the Normal distribution, the region ( - ) < x <
( + )
contains 68.3 per cent of the area, i.e. 68.3 per cent of the ``expected
results''. The caveat is that the Normal distribution has very short
tails - it dies rapidly beyond ± 2, as Fig. 1 shows. Consider, for
example, the comparison of two independent sets of (fictitious) right
ascension measurements as shown in Fig. 2. If
the differences were
Normally distributed, a valid procedure is to calculate their mean to
determine the systematic difference, and then 2diff, the
sample variance, = (N / (N - 1)) times the
mean-square deviation. Suppose that 12 and 22 are the variances known
for each of the two independent sets of right ascension; then the
expected variance in the differences (see, e.g.
(9)) is 12 + 22, and
the computed 2diff may be compared with this,
perhaps to verify the
estimates of the individual variances. However,
Fig. 2 shows a few wild
differences, of the type which inevitably seem to occur in comparisons
of this sort, and which extend the tails far beyond those of a Normal
distribution. (Such differences may arise from computational blunders or
from some disturbance of the underlying probability distributions; see
Section 4.) Moreover, note what happens if we
compute our estimates of
mean and variance as for Normal distributions - these quantities are
completely dominated by the wayward values, and the Normal distribution
which they imply (the dashed curve) fits the data very poorly. But we
can still describe these in terms of a Normal distribution if we are
careful. One way is to reject the large and offensive values from our
(µ, ) estimates;
but this may not be possible, and is undoubtedly
dangerous. A safer method is to use the median as a location measure,
and to adopt as a dispersion measure the ± (after removing the offset)
within which 68.3 per cent of the values lie. This latter statistic is
quite commonly used, and, of course, for the Normal distribution it
corresponds exactly to ± 1.
(after removing the offset)
within which 68.3 per cent of the values lie. This latter statistic is
quite commonly used, and, of course, for the Normal distribution it
corresponds exactly to ± 1.

s and . A better description is obtained when xm, the
median value, is used as the location measure and the ± containing
68.3 per cent of the data as the dispersion measure; the Normal curve
using these parameters as measures of and
is shown dotted.
within which 50 per cent (not 68.3 per cent) of the points lie, It is
sometimes used with justification when the errors in an experiment are
not Normally distributed. However, it is smaller than (~ 0.7 ) and
therefore its use provides cosmetic improvement of results. The
temptation proves too much for some observers.
2 If it is known a priori that the
``real'' frequency distribution of
intensities is not uniform
(Table I, then it may be argued that
w is
not unbiased even though the errors obey a Normal distribution
precisely. Appropriate correction made be made
(5). This is the edge
of an argument between two types of statisticians, the Bayesians and
the Others, which has raged for 200 years. Let us skirt it, for the
moment at least. Back.