


3.3. Faint blue sub-galactic clumps
3.3.1. Sizes
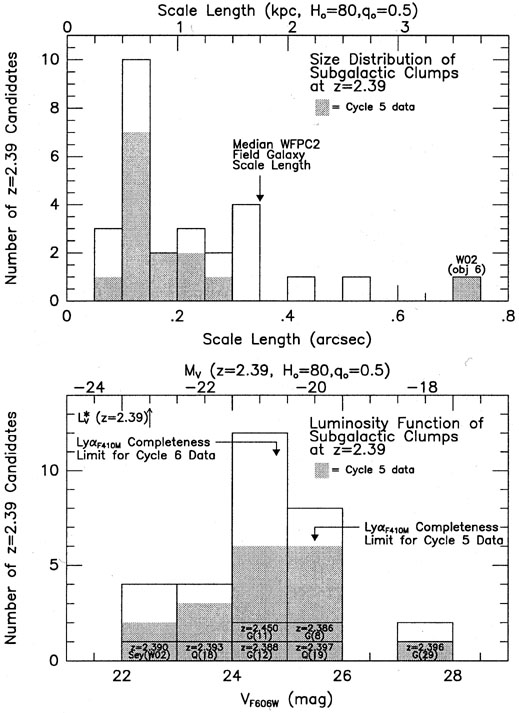
Fig. 5a shows the size distribution for the
z  2.39 candidates from
both the Cycle 5
(shaded, P96b)
and Cycle 6 (open, P97)
fields in F410M. Most z
2.4 candidates are very
compact, with half-light radii rhl
2.39 candidates from
both the Cycle 5
(shaded, P96b)
and Cycle 6 (open, P97)
fields in F410M. Most z
2.4 candidates are very
compact, with half-light radii rhl
 0".1-0".3 or
0.5-1.5 kpc at z
2.4. Their typical
rhl
0".2 is smaller than the
typical WFPC2 galaxy scale-lengths at these
faint magnitudes
( 0".3-0".4 at B
27; see Fig. 1 &
O96).
Several of the Cycle 6 z
2.4 candidates
fall into the rhl = 0".3-0".35 bin, likely due to the
lower signal-to-noise of these images
and the corresponding tendency to overestimate their true sizes. The
z 2.4 candidates,
whose cores are in many cases barely resolved by the HST, are typically
detected at least
3-4 scale lengths out in the deeper Cycle 5 images, suggesting that here
the scale-length
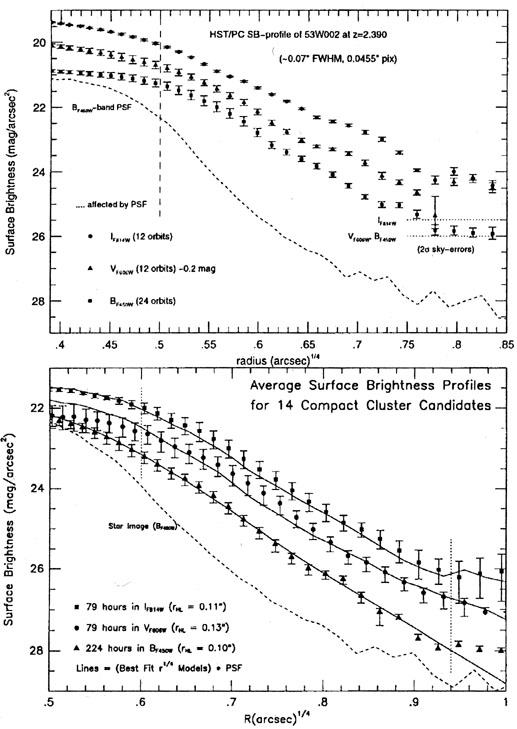
measurements are more robust (see Fig. 6a, which
also shows a typical stellar profile
for comparison). Due to the compactness of these objects, they do not
suffer the full
cosmological (1 + z)4 SB dimming as truly extended
objects do. (Their wings of course do,
which is why any disks may have disappeared into the background noise of
the WFPC2
CCD; cf. Fruchter et al. 1997,
this volume; see also
P96b and
Section 4.3 below). To derive
a mean intensity profile with the greatest dynamic range,
intensity-weighted composite
images of 14 compact and isolated candidates were produced in each
filter, assuming
that the candidates are to first order all similar in shape and size at
z 2.39 (cf.
G96).
The total effective exposure times of the image stacks are 14 x 5.7
hours in F606W and
F814W and 14 x 16 hours in F450W, and have the best SB sensitivity. To
measure the scale-length of the mean observed profile in
Fig. 6a, model profiles were convolved with an
empirical PSF taken from a star in the images. The
B450 and F410M data were almost
properly sampled, owing to 0.5 pixel substeps between individual
exposure sequences,
and the measurements were done on interleaved mosaics on 0.5-pixel
centers. In each
filter, the profiles are better fitted by an r1/4-law
than by a disk-like exponential over a
range of almost five magnitudes in SB. The continuum scale-lengths of
the candidates have a mean value of 0".11
( 0.5 kpc at z
2.39) and are very similar in
BVI, showing
no dependency on restframe wavelength below ~ 4000 Å.
0".1-0".3 or
0.5-1.5 kpc at z
2.4. Their typical
rhl
0".2 is smaller than the
typical WFPC2 galaxy scale-lengths at these
faint magnitudes
( 0".3-0".4 at B
27; see Fig. 1 &
O96).
Several of the Cycle 6 z
2.4 candidates
fall into the rhl = 0".3-0".35 bin, likely due to the
lower signal-to-noise of these images
and the corresponding tendency to overestimate their true sizes. The
z 2.4 candidates,
whose cores are in many cases barely resolved by the HST, are typically
detected at least
3-4 scale lengths out in the deeper Cycle 5 images, suggesting that here
the scale-length
measurements are more robust (see Fig. 6a, which
also shows a typical stellar profile
for comparison). Due to the compactness of these objects, they do not
suffer the full
cosmological (1 + z)4 SB dimming as truly extended
objects do. (Their wings of course do,
which is why any disks may have disappeared into the background noise of
the WFPC2
CCD; cf. Fruchter et al. 1997,
this volume; see also
P96b and
Section 4.3 below). To derive
a mean intensity profile with the greatest dynamic range,
intensity-weighted composite
images of 14 compact and isolated candidates were produced in each
filter, assuming
that the candidates are to first order all similar in shape and size at
z 2.39 (cf.
G96).
The total effective exposure times of the image stacks are 14 x 5.7
hours in F606W and
F814W and 14 x 16 hours in F450W, and have the best SB sensitivity. To
measure the scale-length of the mean observed profile in
Fig. 6a, model profiles were convolved with an
empirical PSF taken from a star in the images. The
B450 and F410M data were almost
properly sampled, owing to 0.5 pixel substeps between individual
exposure sequences,
and the measurements were done on interleaved mosaics on 0.5-pixel
centers. In each
filter, the profiles are better fitted by an r1/4-law
than by a disk-like exponential over a
range of almost five magnitudes in SB. The continuum scale-lengths of
the candidates have a mean value of 0".11
( 0.5 kpc at z
2.39) and are very similar in
BVI, showing
no dependency on restframe wavelength below ~ 4000 Å.
The question arises as to whether or not one is seeing the full extent
of these z 2.4
candidates. The K-correction for young spectral-energy
distributions at z 2.39 could
have compensated for at least some of the cosmological (1 +
z)4 SB dimming
(W91).
Unlike the initial burst of star formation that may take place in
ellipticals and the bulges
of spirals, disk star formation rates can be almost constant with time
(K89). Disks can,
therefore, actually brighten toward decreasing redshift for a
significant time, eventually
reaching an approximately steady level until gas exhaustion. However,
with the exception of 53W002 itself, which already has at z
2.39 a
r1/4-like profile with a relatively large
scale-length (Figs. 5a & 6b),
suggesting a massive early-type galaxy
(W92,
W98), and
was by selection included in this WFPC2 field, none of the other
candidates are yet fully
assembled massive ellipticals or spirals. Their scale-lengths are quite
comparable to those of bulges in local spirals, which range from 0.2-4
kpc with a type-dependent median close
to 1 kpc for S0-Sbc's. Given that the average value of the bulge-to-disk
scale-length ratio
of nearby late-type galaxies is ~ 0.07 ± 0.04
(Co96), these
z 2.39 candidates may be
subgalactic-sized (compact) and young (blue) spheroids, possibly
representing the bulges
of young galaxies that have not (yet) developed significant disks around
them, and/or
disks that are reduced in brightness in the HST images by the severe
SB-dimming (Section 4.3).
|
Figure 5. (a) [Top] Histogram of WFPC2
continuum scale-lengths for the
significant Ly |
3.3.2. Luminosities
Fig. 5b shows the luminosity distribution of all
significant F410M z 2.4
candidates from Cycles 5 (shaded,
P96b) and 6
(open, P97).
The implied luminosities
at z 2.39
for all candidates range typically from MV
-23 to -18 mag, based on the stellar
population models, age estimates, and K-corrections from
W91.
With BVI photometry, the K-corrections are
straightforward, provided that redshifts
are known to be at z
2.39 either from spectroscopy or from the (F410M-B450)
colors. Subtraction of any
contributions from an AGN was done following
W92. The (evolving)
absolute magnitude of an L* galaxy at z
2.4 is MV
-23 mag, assuming that there
would have been ~ 2 mag of luminosity evolution since z
2.39 for a typical starburst ~
(0.3-0.5) x 109
years earlier, as the candidates' unreddened blue colors suggest
(Fig. 4 &
P96b).
|
Figure 6. (a) [Top] Average light profiles
vs. radius (in
r1/4 units) of the 14 z
|
The z 2.4 sample is not
complete for V606
 25.5 mag
(MV
-20 mag), as shown
by the downwards arrows, which indicates the shallower completeness
limit of the
underexposed F410M images, compared to B450 or
V606. Given this completeness limit, the
true luminosity distribution of the z
2.4 candidates thus likely
continues for MV
-20 mag, and the initial (luminous) mass spectrum of this group of
z 2.4 candidates
could be quite steep. The Cycle 5 and Cycle 6 F410M data sets contain
mostly z 2.4
candidates with MV
-20.5 to -21.5 mag. Assuming
that most significant F410M
emitters are at z 2.4
and given the K-corrections discussed above, these are sub-L*
luminosities. Therefore, if indeed their stellar populations are young,
most of the z 2.4
candidates have luminosities of
0.1-1 L*, and so
possibly had only ~ 109-1010
M
25.5 mag
(MV
-20 mag), as shown
by the downwards arrows, which indicates the shallower completeness
limit of the
underexposed F410M images, compared to B450 or
V606. Given this completeness limit, the
true luminosity distribution of the z
2.4 candidates thus likely
continues for MV
-20 mag, and the initial (luminous) mass spectrum of this group of
z 2.4 candidates
could be quite steep. The Cycle 5 and Cycle 6 F410M data sets contain
mostly z 2.4
candidates with MV
-20.5 to -21.5 mag. Assuming
that most significant F410M
emitters are at z 2.4
and given the K-corrections discussed above, these are sub-L*
luminosities. Therefore, if indeed their stellar populations are young,
most of the z 2.4
candidates have luminosities of
0.1-1 L*, and so
possibly had only ~ 109-1010
M processed into stars at z
2.39. For these parameters, the
free-fall time expected for
these clumps is ~ (2-4) x 108 years, long enough that the
original population of short-lived
O and early B stars are gone, but comparable to the age of the dominant stellar
population (late B and early A stars). Hence, there was indeed enough
time for their
mass distributions to settle into regular r1/4-like
light profiles.
processed into stars at z
2.39. For these parameters, the
free-fall time expected for
these clumps is ~ (2-4) x 108 years, long enough that the
original population of short-lived
O and early B stars are gone, but comparable to the age of the dominant stellar
population (late B and early A stars). Hence, there was indeed enough
time for their
mass distributions to settle into regular r1/4-like
light profiles.
 emitting
z
emitting
z  sky-subtraction errors, which affect the
profiles for r1/4
sky-subtraction errors, which affect the
profiles for r1/4