


3.1 The log N - log S relation
Having the COBE data definitely eliminated the possibility of an important contribution of diffuse gas emission to the XRB, the important question to be addressed is now: what are the sources that are responsible for the observed XRB? In this Section I will discuss some recent results, relevant to this question, obtained with ROSAT.
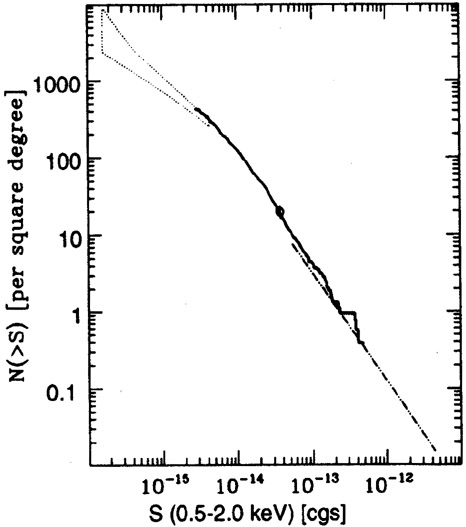
The good angular resolution and sensitivity of the Position Sensitive Proportional Counter aboard ROSAT have allowed to extend to significantly lower fluxes the deep imaging studies first performed with EINSTEIN. The deepest ROSAT image has been obtained by Hasinger et al. (1993) in the direction of the Lockman Hole, characterized by an extremely low neutral hydrogen column density. A total of 152 ksec of PSPC observations have been accumulated in this pointing. Seventy-five sources have been detected in the hard (0.4-2.4 keV) ROSAT band in the inner 15.5 arcminutes, corresponding to a surface density of about 360 sources/sq.deg. These data have been used by Hasinger et al., together with additional data from 26 other shallower ROSAT exposures, to obtain the log N - Log S relation shown in Figure 2. The total number of sources used in the construction and analysis of the log N - log S relation is 661 and they cover a range of more than two decades in flux.
|
Figure 2. Integral source counts for ROSAT data. The dash-dotted line represents the best fit to the EINSTEIN Medium Sensitivity Survey total sample (i.e. galactic and extragalactic). The open circle represents the EINSTEIN Extended Deep Survey point. The dotted area at faint fluxes shows the 90% confidence regions from the fluctuation analysis of the deepest ROSAT field in the Lockman Hole (Hasinger et al. 1993). |
The observed flux distribution of these sources has been fitted with a model in which the differential counts (N(S)) are represented by two power laws:
|
After detailed Monte Carlo simulations aimed at understanding and correcting
all possible systematic effects present in the source detection
procedure, the best fit
parameters obtained for the above parameterization are:
 1 = 2.72
± 0.27,
2 =
1.94 ± 0.19, Sb = (2.66 ± 0.66) x
10-14 erg cm-2 s-1.
1 = 2.72
± 0.27,
2 =
1.94 ± 0.19, Sb = (2.66 ± 0.66) x
10-14 erg cm-2 s-1.
In order to obtain constraints on the shape of the log N - log S relation below the discrete source detection threshold, a fluctuation analysis of the intensity distribution in the inner region of the Lockman field has been performed. On the basis of extensive simulations, which took into account all known systematic instrumental effects, it has been obtained the 90% confidence region shown by the dotted area at faint fluxes in Figure 2.
In summary, the main results of this analysis of the ROSAT log N - log S relation are:
3.2 The optical identifications
The X-ray log N - log S shown in Figure 2 includes all the X-ray sources, without any selection on the basis of the optical counterparts. The obvious questions now are: which fraction of these sources are extragalactic? what are the optical identifications of these sources? Systematic work aimed at identifying the optical counterparts of faint ROSAT sources is in progress. Such a work requires a large amount of telescope time because of the faintness of some of these counterparts. Typical magnitudes for various classes of sources with a ROSAT flux ~ 10-14 erg cm-2 s-1 are shown in Table 1; these magnitudes have been estimated on the basis of the typical X-ray to optical ratios of the about 800 X-ray selected sources of the EMSS (Maccacaro et al. 1988).
| Objects | mv |
| B - F stars | 10.0 - 14.5 |
| M stars | 13.5 - 19.5 |
| Normal Galaxies | 16.0 - 19.0 |
| AGNs | 18.5 - 23.5 |
| BL Lacs | 21.5 - 25.0 |
At a flux limit of Sx ~ 10-14 erg
cm-2 s-1 there are at least four ROSAT fields
with a high percentage of optical identifications already
available. These fields are the
Lockman and the Marano fields, studied by Hasinger and collaborators,
and the QSF1
and QSF3 fields studied by Boyle, Shanks and collaborators. While the
spectroscopic
observations for the optical identifications of the Lockman field have
been obtained
after acquiring the ROSAT data (Schmidt et al., in preparation), the
other three fields
had already been studied spectroscopically before the ROSAT data in
order to obtain
complete optically selected samples of AGNs with mB
 22.0
(Marano, Zamorani and
Zitelli 1988;
Zitelli et al. 1992;
Boyle et al. 1990).
X-ray data and a discussion
of the optical identifications of the QSF1 and QSF3 fields have been
presented by
Shanks et al. (1991) and
Boyle et al. (1993).
The total number of X-ray sources with
Sx
22.0
(Marano, Zamorani and
Zitelli 1988;
Zitelli et al. 1992;
Boyle et al. 1990).
X-ray data and a discussion
of the optical identifications of the QSF1 and QSF3 fields have been
presented by
Shanks et al. (1991) and
Boyle et al. (1993).
The total number of X-ray sources with
Sx  10-14 erg cm-2 s-1 in the
inner regions of these four ROSAT fields is 119; 90 of
these sources (~ 76%) have already been classified
spectroscopically. The results of this
identification process are shown in Table 2,
along with a comparison with the almost
complete identifications of the EMSS survey
(Stocke et al. 1991).
10-14 erg cm-2 s-1 in the
inner regions of these four ROSAT fields is 119; 90 of
these sources (~ 76%) have already been classified
spectroscopically. The results of this
identification process are shown in Table 2,
along with a comparison with the almost
complete identifications of the EMSS survey
(Stocke et al. 1991).
| Sample | AGNs | BL Lacs | Galaxies | Clusters | Stars | No Id. | |
| ROSAT Deep | Surveys | 61% | 1% | 5% | - | 8% | 24% |
| EMSS | 51% | 4% | 2% | 12% | 26% | 4% | |
Most of the objects still without optical identifications are optically
faint and therefore
are likely to be extragalactic (see Table 1). In
addition to AGNs, BL Lacs and
galaxies, some of these sources will turn out to be clusters. Although a
few possible
cluster candidates have already been identified, no percentage for
clusters in the Rosat
deep surveys has been given in Table 2, because
more spectroscopic data on faint galaxies
are needed in order to establish the reliability of the proposed
identifications. Since
almost all the stars in the sample have probably already been
identified, we can
conclude that the final percentage of stars in the ROSAT deep surveys
should be 10%,
significantly smaller than the percentage of stars found in the brighter
EMSS survey.
Vice versa, already at this preliminary stage the fraction of AGNs in
the ROSAT deep
surveys (61%) is higher than in the EMSS survey, and could be as high as
86% in the
extreme hypothesis that all the sources still to be identified are
AGNs. This shows
without any doubt that AGNs are the dominant population among the X-ray sources
at this flux.
What are expected to be the X-ray sources at fluxes even fainter than the current ROSAT flux limit? The most "economic" hypothesis is that they are still AGNs, fainter than those detected so far. If so, which region of the redshift-luminosity plane are they expected to fill? Figure 3, which shows redshift versus X-ray luminosity for the EMSS (small dots) and ROSAT deep surveys (large dots) AGNs, can help us in defining the region of interest. The figure clearly shows the increase in the median redshift from ~ 0.3 for the EMSS AGNs to ~ 1.4 for the ROSAT AGNs. Shanks et al. (1991) have shown that the redshift distribution of the ROSAT deep survey AGNs is similar to that of faint optically selected AGNs. Because of the presence of the redshift cutoff at z ~ 2.5, however, we expect that AGNs at even fainter X-ray fluxes will mainly populate the region corresponding to the faint part of the X-ray luminosity function in the redshift interval 0.4-2.5 (see area "A" in Figure 3), rather than the higher redshift region. The best fit of the differential slope of the log N - log S in the fluctuation analysis is 1.8 (Hasinger et al. 1993); on the other hand, the slope of the faint part of the X-ray luminosity function, as derived by Boyle et al. (1993), is 1.7 ± 0.2. The agreement between these two slopes suggests that it is quite possible, or at least consistent with the presently available data, that AGNs would provide the bulk of the X-ray sources at least down to fluxes 2 x 10-16 erg cm-2 s-1. It is also clear from the figure that in this case most of the AGN contribution to the XRB would come from objects with X-ray luminosities smaller than 1044 erg s-1, similar to the X-ray luminosity of Seyfert galaxies.

|
Figure 3. Redshift versus X-ray luminosity for the EMSS (small dots) and ROSAT deep surveys (large dots) AGNs. The dotted line corresponds to z = 3, while the two dashed lines correspond to ROSAT fluxes 2 x 10-16 and 5 x 10-15 erg cm-2s-1, respectively. |
As seen in Table 2, the percentage of galaxies in
the ROSAT deep surveys (~ 5%)
is higher than the corresponding percentage in the EMSS (~ 2%). At the limit of
Sx ~ 10-14 erg cm-2
s-1 the number of galaxies is only 10% of the number
of AGNs.
However, while the differential slope of the X-ray log N - log S at
these fluxes is
slightly flatter than two, the corresponding slope for the optical
counts of galaxies in the B band is ~ 2.1
(Tyson 1988)
in the range of magnitudes 18-27. The steeper
slope in the optical counts of faint galaxies implies that, even without
evolution in
the ratio of X-ray to optical blue fluxes, the ratio between galaxies
and AGNs might increase toward fainter X-ray fluxes. Actually,
Griffiths and Padovani (1990)
have suggested that star-forming galaxies, with some evolution, may be a
major component
of the XRB. The expected X-ray log N - log S for these galaxies is
strongly model dependent. From Figure 5 in
Griffiths and Padovani
(1990)
it is seen that, under some
assumptions, these objects might become a very substantial fraction of
the faint X-ray sources at fluxes Sx
10-15 erg
cm-2 s-1.
Griffiths et al. (1993)
are presenting some
evidence from their preliminary optical identifications that the galaxy
population is
already becoming important and of the same order as the AGN population
in the flux
range Sx = (5 - - 10) x 10-15 erg
cm-2 s-1. Obviously, this result has to
be confirmed
with more extensive identifications of X-ray sources at faint ROSAT fluxes.