


3.1.3. Morphologies of Lyman-limit systems considered dangerous
Deep HST imaging of galaxies selected on the basis of colour to be at redshifts z > 2 has provided an important breakthrough in our understanding of high-redshift morphology [81, 42]. Such surveys probe systems seen at ages corresponding to 10-20% of the present age of the Universe. So far the results appear somewhat contradictory. Early studies focussed on the compact cores of these systems, which appear well-modelled by r1/4 law profiles, suggestive of proto-ellipticals (Giavalisco et al. 1996). Deeper observations have revealed morphological characteristics among the most bizarre yet seen on deep HST data (Fig. 5). Whether the morphologies of Lyman limit systems are interpreted as fairly regular or totally bizarre is a strong function of the limiting surface brightness of the observations, and whether the complex structures linking the bright knots have been resolved. Thus any interpretation of the morphologies of Lyman limit galaxies remains speculative. In the context of these lectures perhaps the best that can be done is to present explicitly the various factors that make the interpretation of the z > 1.5 morphological data so subtle.
|
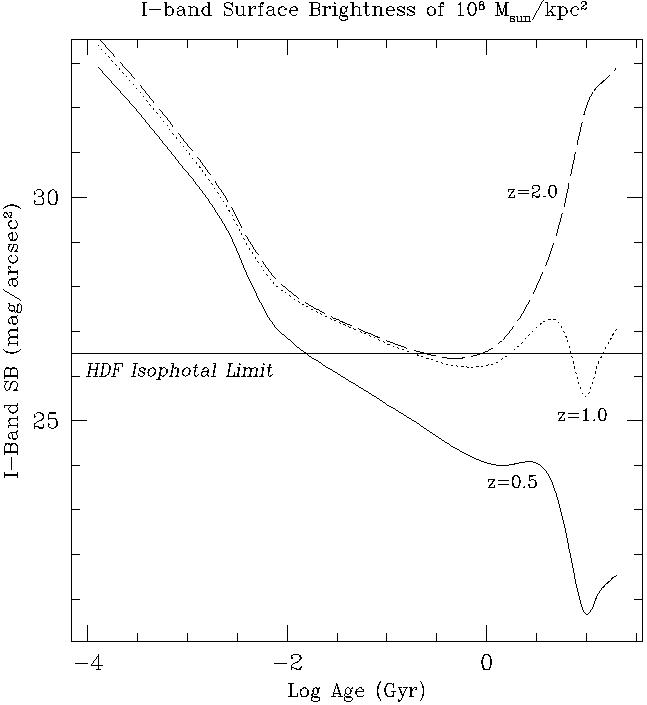
Figure 6. Predicted I-band surface
brightness as a function of age
for a stellar population with a projected surface mass density of
108 M |
The most obvious complication is that Lyman break systems are being
observed at rest wavelengths so far in the ultraviolet that even the
relatively sparse ground-based U-band data of local systems provide
a poor reference standard for comparison. (In fact, the handful of
local systems observed with the Ultraviolet Imaging Telescope on
the Astro-1 and Astro-2 missions provide the best calibration
reference.) In any case, Lyman limit systems are at redshifts so high
that the effects of evolution must be incorporated explicitly
when making meaningful comparisons. At the epoch being observed, the
Universe may simply be too young to have evolved the old stellar
populations that play an important role in defining local
morphology. Also, extraordinarily strong surface-brightness selection
effects bias against the detection of even intermediate-aged stellar
populations. These latter points are perhaps best understood from
plots such as that shown in Figure 6, which
illustrates the surface
brightness of a surface mass density as a function of population age
and observed redshift. Stellar populations with ages greater than
1-2 Gyr are strongly biased against in observations at z > 1.5, and
only the youngest stellar populations (the ``tip of the iceberg'' in
terms of stellar mass) are detectable. On the other hand, if
 is large then the Universe at z ~ 2-3 may be sufficiently young
that the populations biased against would not have time to have
formed, so a large proportion of the total mass would be detectable.
is large then the Universe at z ~ 2-3 may be sufficiently young
that the populations biased against would not have time to have
formed, so a large proportion of the total mass would be detectable.
 kpc-2. The three curves shown correspond to
stellar populations with exponential star formation histories (with
e-folding timescales of 1 Gyr) seen at redshifts z = 0.5,
z = 1.0, and
z = 2.0. Calculations are based on the predictions of the GISSEL96
spectral synthesis package (Bruzual & Charlot 1996). Also shown is
the approximate I-band (F814W) isophotal detection limit for the
Hubble Deep Field. Note the precipitous decline in visibility of older
stellar populations with redshift. Curves such as these suggest that
beyond z > 1.5 substantial mass could be locked in ``old'' (ages
greater than one or two Gyr) stellar populations that would be
undetectable even in red optical bands.
kpc-2. The three curves shown correspond to
stellar populations with exponential star formation histories (with
e-folding timescales of 1 Gyr) seen at redshifts z = 0.5,
z = 1.0, and
z = 2.0. Calculations are based on the predictions of the GISSEL96
spectral synthesis package (Bruzual & Charlot 1996). Also shown is
the approximate I-band (F814W) isophotal detection limit for the
Hubble Deep Field. Note the precipitous decline in visibility of older
stellar populations with redshift. Curves such as these suggest that
beyond z > 1.5 substantial mass could be locked in ``old'' (ages
greater than one or two Gyr) stellar populations that would be
undetectable even in red optical bands.