


C. Proper Motions in the Jet
It is possible to discern motions in the jet by comparing images made at several epochs. Comparisons of 1.7 GHz VLBI observations from three epochs have shown motion of feature N2 in the parsec-scale jet located about 20 mas (1.6 pc) from the core (Reid et al. 1989). This feature appears to move outward at an apparent speed of 0.28 ± 0.08 c (Figure 16).

|
Figure 16. Intensity profiles through nucleus and along jet at 1.7 GHz with 8 mas resolution for epochs 1980, 1982, and 1984. The feature N2 appears to move away from the core at 1.1 ± 0.3 mas yr-1 (0.28 ± 0.08 c). From Reid et al. 1989. |
Motions in the kiloparsec-scale jet have been detected by comparing high dynamic range 15 GHz VLA images observed at several epochs (Biretta and Owen 1990; Biretta and Owen 1993). The data are from two epochs in 1985, with another two in 1989. A fifth epoch from 1982 has poor dynamic range, but provides useful information on knot A. After an initial "cross-calibration" (Mason 1986) against the 26 Feb. 1985 data, each epoch was reduced independently and in the same manner. Final images were made using the Maximum Entropy Method and data from the A, B, and C configurations of the VLA. Small changes in the positions of features were then measured using a two-dimensional cross-correlation technique (Biretta, Owen, and Cornwell 1989, hereinafter BOC89). Because of the high sensitivity of the cross-correlation technique, and the high dynamic range of the images, it is possible to measure position changes to an accuracy better than 1 percent of the 0.15 arcsecond resolution of the images.
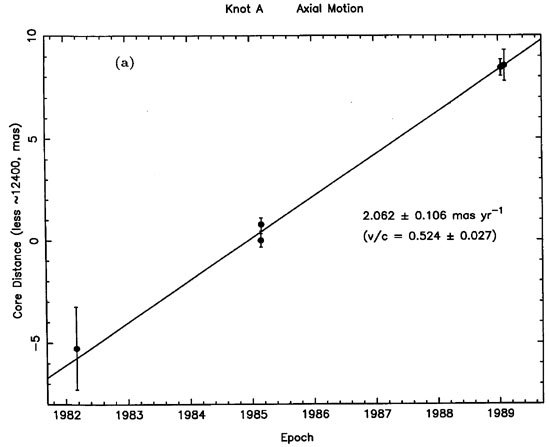
The results for knot A, the brightest knot, are shown in Figure 17a. Here changes in the position of knot A relative to the 26 Feb. 1985 reference position are plotted against epoch. This knot appears to move away from the nucleus with a proper motion of 2.06 ± 0.11 mas yr-1, which corresponds to an apparent speed of 0.52c ± 0.03c, where c is the velocity of light. The two-dimensional cross-correlation technique also measures any position change in the transverse direction. Any such motion normal to the jet axis is very small in knot A, with the formal value being -0.025c ± 0.035c (Figure 17b). Together the two components of motion give a net motion directly away from the nucleus.
|
Figure 17. Motion of knot A relative to the nucleus. (a.) Axial component of motion (along jet axis). Knot A moves away from the nucleus at 2.06 ± 0.11 mas yr-1 or 0.52c ± 0.03c. |

|
Figure 17. (Continued.) (b.) Transverse component of motion (normal to jet axis). There is essentially no motion in direction normal to the jet axis. In both plots zero distance is arbitrarily set to the epoch 1985.1 position. Results are derived from 15 GHz VLA images with 0.15" resolution. From Biretta and Owen 1993. |
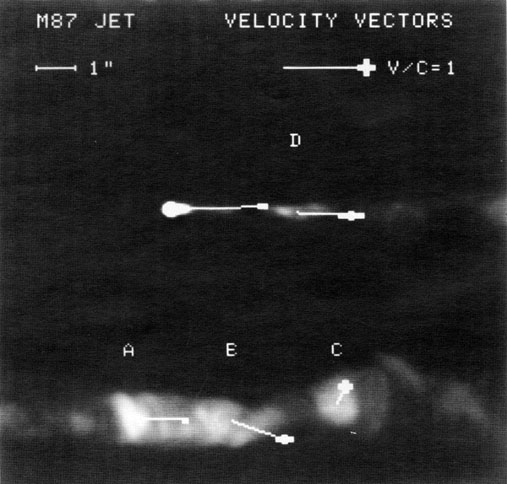
The same technique can be applied to other bright knots, and the results are shown in Figure 18 as vectors plotted on the respective knots. Knots D and B, located about 200 and 1200 pc from the nucleus, show outward motion at 0.66c ± 0.15c and 0.63c ± 0.09c, respectively. Knot C, located near the end of the jet, is appreciably slower at 0.12c ± 0.07c. Neither knots D nor A, which are located in the region where the jet is quite straight, show significant motion normal to the jet axis. However, both knots B and C, which are located in the region where the jet begins to bend and kink, show significant transverse motion at -0.24c ± 0.05c and 0.23c ± 0.09c, respectively (positive transverse motion means towards P.A. 70 degrees).
|
Figure 18. Observed velocity vectors superimposed on radio image of the jet. The velocities are derived from 5 epochs of 15 GHz VLA observations between 1982 and 1989. The velocity scale is indicated by the vector at the upper right; the heavy cross at the head of each vector illustrates its uncertainty. The jet is split into two pieces for photographic reasons; the nucleus and inner jet are in the top panel; knots A, B, and C are in the bottom panel. Data from Biretta and Owen 1993. |
This technique can also measure motions for smaller condensations within the knots, and this has produced interesting results. For three condensations within knot D we obtain speeds 0.13c ± 0.17c, 1.7 ± 0.4c, and 3.0 ± 0.4c, the latter two with velocity vectors pointing straight down the jet. Five different condensations in knot B give speeds ranging from -0.4c ± 0.3c to 1.3 ± 0.2c. Significant transverse motions are seen for some of these condensations in knot B - which, again, are located where the jet begins to bend and kink. These results suggest that some of the knots have a significant degree of internal turbulence, or at least cannot be thought of as simple rigid structures sliding down the jet.
There is some element of uncertainty in these proper motion results, primarily because the technique is new, and there is as yet no independent confirmation. We note that similar work in 3C120 has produced conflicting results (Walker, Walker, and Benson 1988; Muxlow and Wilkinson 1991). Observations with the Space Telescope offer the possibility of a completely independent confirmation of these results.