


5.4.2. Small Scale Constraints
Dwarf Galaxies and Massive Halos
While the HDM scenario is very attractive for giving the Universe its observed power on large scales and for having an identified candidate particle (e.g., the neutrino), there are two small scale constraints that essentially completely rule out the theory. One constraint is provided by the maximum phase space density that neutrinos could have. This was first pointed out by Tremaine and Gunn (1979) and works as follows:
If neutrinos have a mass, then at some point in their cosmic evolution
they must become non-relativistic and, like baryons, become trapped
in a galactic potential. If the the neutrinos are sufficiently massive
(e.g.,  30 eV) they can dominate
this halo mass. For a spherical
halo, the escape velocity is given from Newtonian dynamics as
30 eV) they can dominate
this halo mass. For a spherical
halo, the escape velocity is given from Newtonian dynamics as
|
For galaxies like the Milky Way which have M ~ 1011 - 1012 and R ~ 10 - 30 kpc, Vesc ranges from 300 to 500 km s-1. If the halo is dominated by neutrinos, then an important exclusion principle comes into play.
Neutrinos are fermions and only one fermion can occupy a unit volume of phase
space. The maximum
positional space is the volume of the halo and the maximum momentum space
is m Vesc. Hence the total phase space volume, which by
the exclusion principle is equivalent to the total number of neutrinos
that exist in this volume is given by
Vesc. Hence the total phase space volume, which by
the exclusion principle is equivalent to the total number of neutrinos
that exist in this volume is given by

| (35) |
or, using the expression for escape velocity
| (36) |
An upper bound on the total mass of neutrinos in this halo is then
| (37) |
where M on the left hand side is really the total number
of neutrinos (N) times
m. Thus we can now
write an
lower bound for m:
| (38) |
For normal galaxies, the constraint is relatively uninteresting as it leads
to an lower bound on neutrino mass of a few eV. However, there is
some evidence that the dwarf satellite companions to the Milky Way
(e.g., Draco, Ursa Minor) are gravitationally bound systems instead
of expanding systems due to tidal encounters associated with their
low perigalactic orbits (see Piatek and Pryor 1995).
These systems are characterized by
M ~ 107 and R ~ 0.1 kpc. For these objects,
equation 38 then gives an lower bound on
m of 500 eV. A
stable neutrinos
species with a mass this large can easily be ruled out on cosmological
grounds as the Universe would have collapsed long ago.
High Redshift Galaxies
Another strong constraint comes from the existence of galaxies at
high redshift. Top down scenarios require fairly long times for
large scale instabilities
to fragment down to smaller scales. For a neutrino dominated Universe,
the initial mass scale is 104 times that of even a large galaxy.
A rough timescale for
this process to occur would be a dynamical timescale. At z = 0
a typical supercluster has a radius of 5-10 Mpc and a velocity
dispersion of 500 km s-1. These structures themselves are not
virialized
but they do contain one or more virialized cores which we identify
with smaller scale clusters of galaxies of radius
 1 Mpc. From
these parameters, we derive a crossing time of
1010 years
which is an appreciable fraction of the Hubble time. Thus we
expect late galaxy condensation and formation in this top-down
scenario. This is clearly not observed and is regarded by most
as conclusive evidence that we do not live in a neutrino dominated
Universe.
1 Mpc. From
these parameters, we derive a crossing time of
1010 years
which is an appreciable fraction of the Hubble time. Thus we
expect late galaxy condensation and formation in this top-down
scenario. This is clearly not observed and is regarded by most
as conclusive evidence that we do not live in a neutrino dominated
Universe.
The Epoch of Galaxy Formation
Clearly, the best constraint on galaxy formation will come when we
actually observe the process and identify at what redshift galaxies
begun to form. Recent ground-based observations have
now detected galaxies, at redshift
z 3. Steidel (et
al. 1995) have unambiguously detected star
forming galaxies at this redshift. The amount of star formation
present at this redshift appears to be 5-10 times less than at
redshift z = 1-1.5. At redshift z = 4, the overall star formation
is down by a factor of 5 relative to z = 3. Furthermore, in these high
redshift objects, the star formation seems to be confined to much
smaller spatial scales, centered on the galaxy, than at lower redshift.
Since the production of metals is strongly correlated with the star
formation per unit volume at some epoch, z, then the rise in this
rate should correlate with the rise in the metal abundance of QSO
absorption lines. The data to date are consistent with this expectation
and indicate a rough peak in star formation per unit volume at z
= 1.5-2.
In addition to high-redshift galaxies detected by Steidel et al.,
Hu et al. (1996) have detected the presence of
Lyman emitting galaxies
which are located near QSOs at z
4.5. While the exact nature of
these galaxies is unclear, they do conform to the simplest expectation
that the initial epoch of star formation at high redshift in galaxies
should give rise to
Lyman recombination
radiation.
emitting galaxies
which are located near QSOs at z
4.5. While the exact nature of
these galaxies is unclear, they do conform to the simplest expectation
that the initial epoch of star formation at high redshift in galaxies
should give rise to
Lyman recombination
radiation.
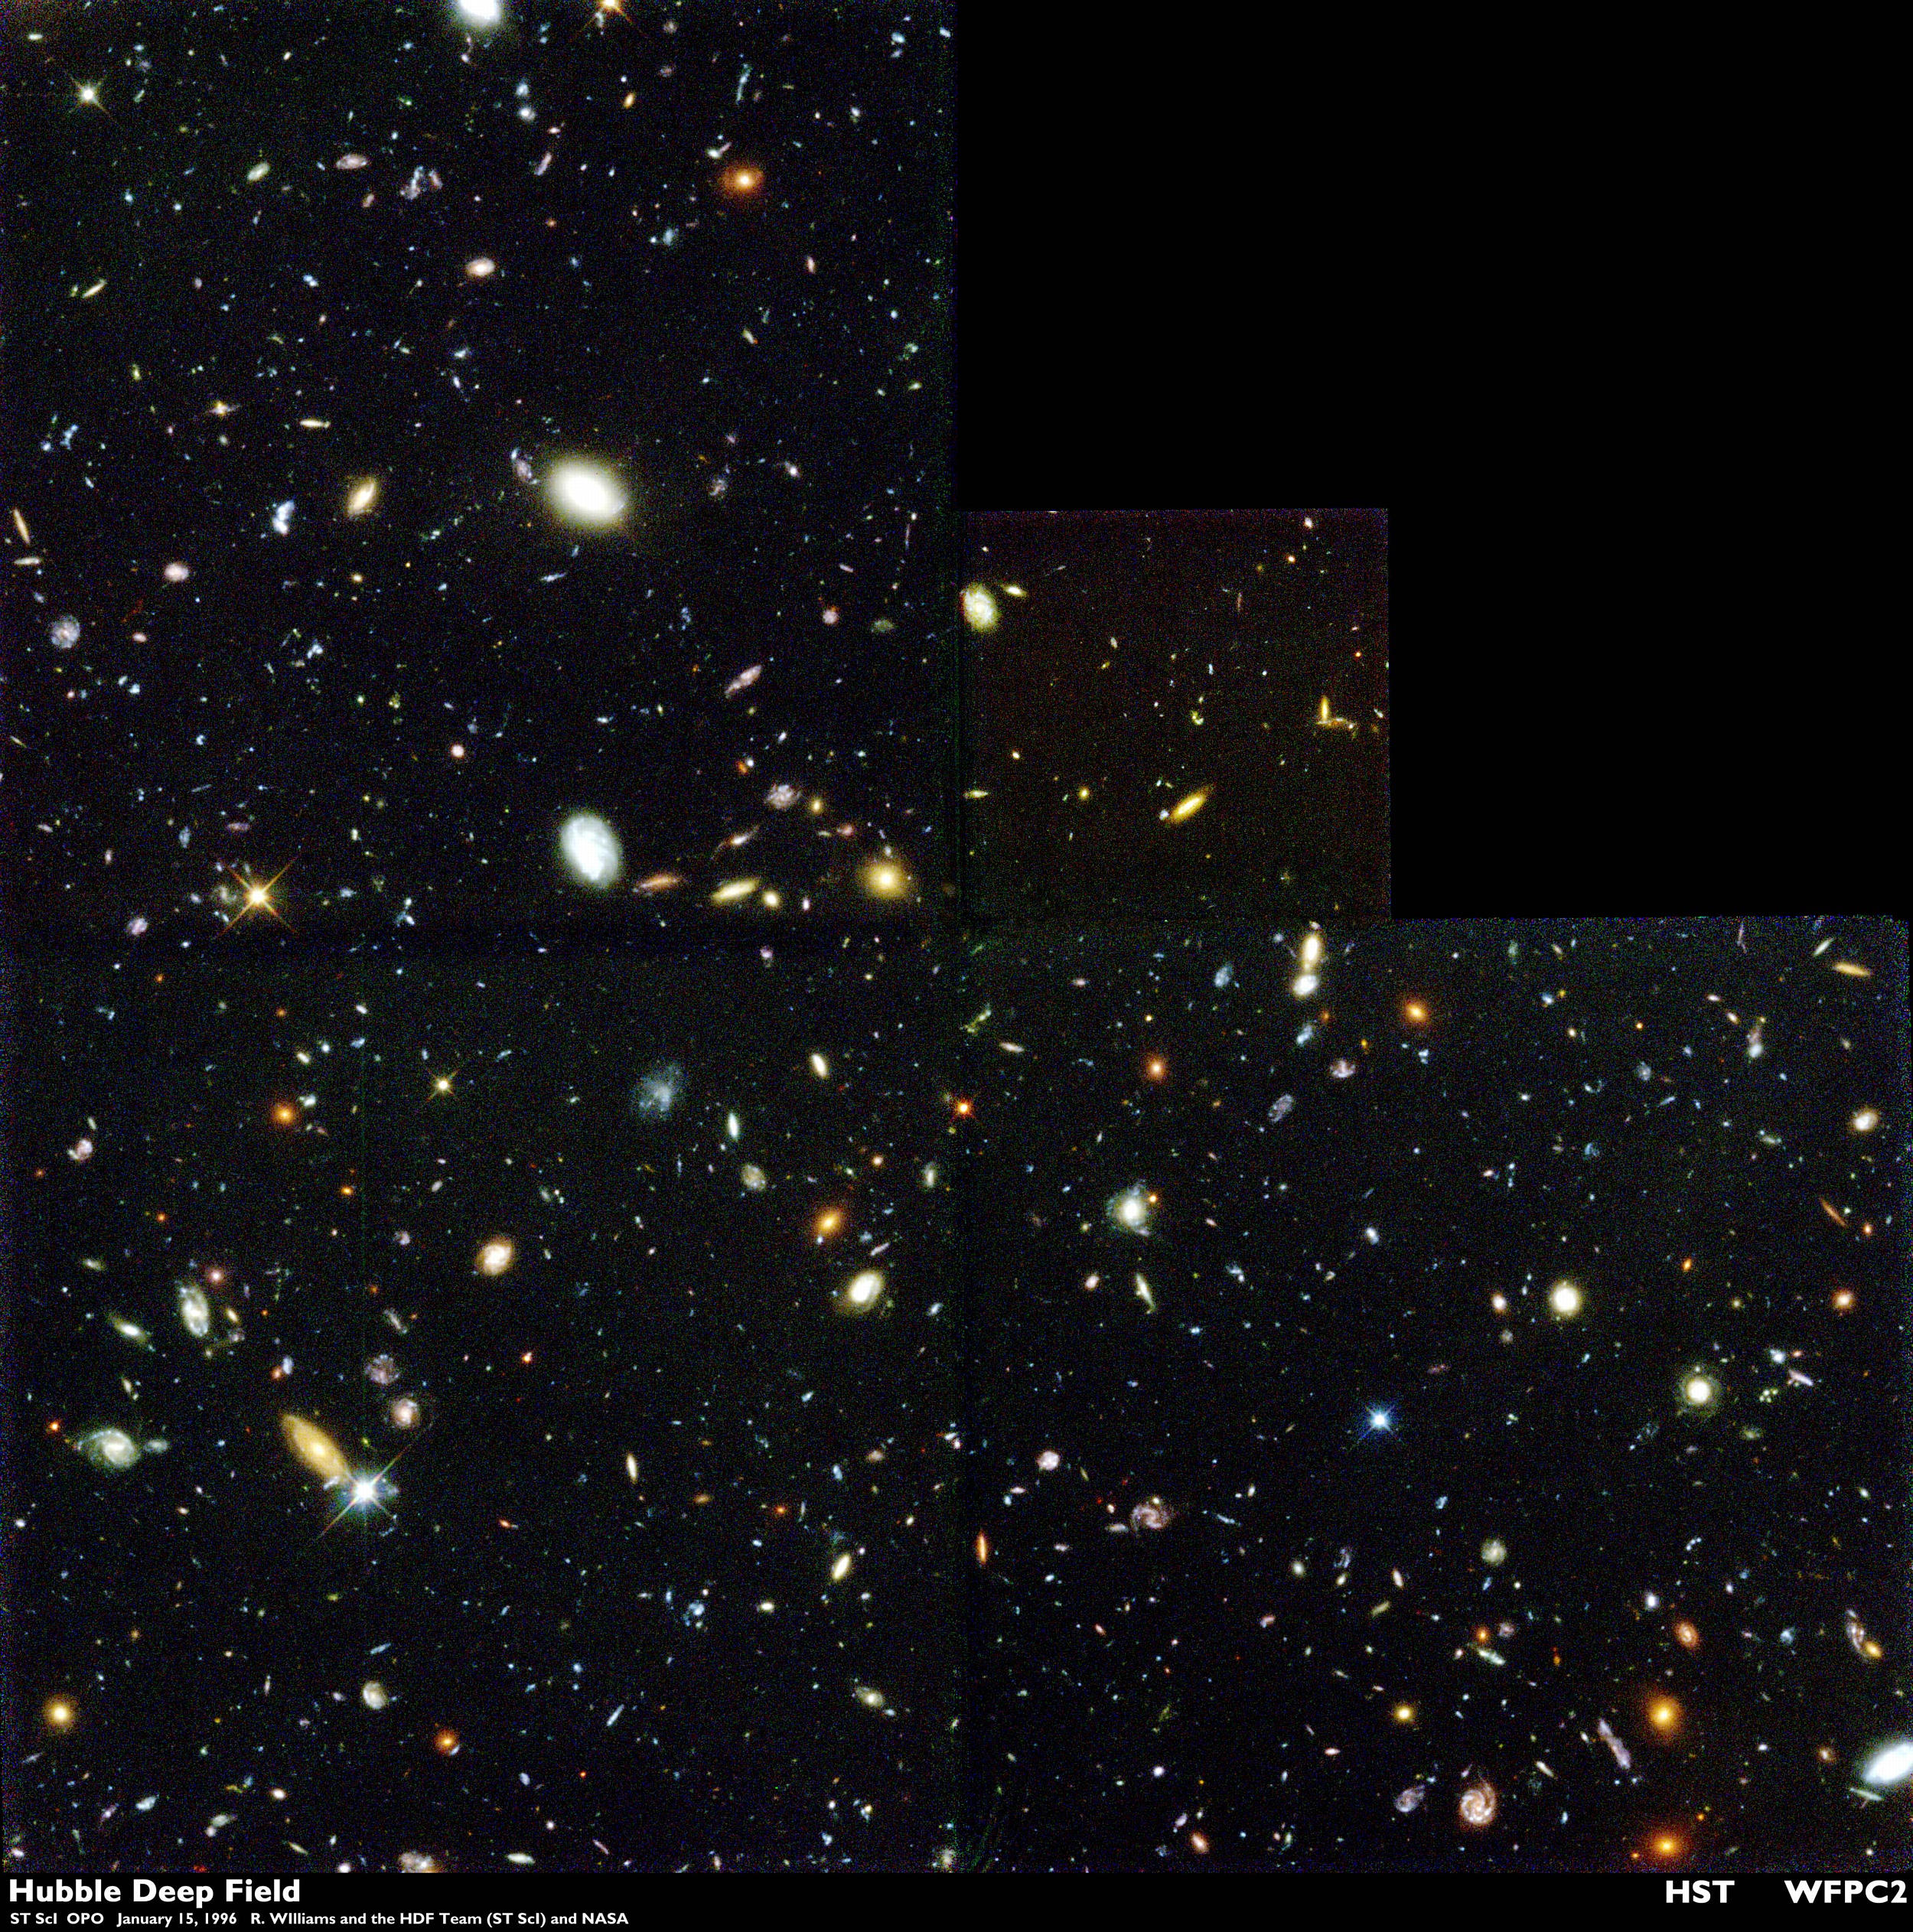
A rich data set for further investigating the properties of high-redshift
galaxies is the Hubble Deep Field data (obtained in December 1995).
Figure 5-3 shows the data and it is quite
striking. Many of the galaxies
in this field look like they are in the process of formation as
they are composed of multiple condensations which may be in the process
of merging together to form one, large galaxy. The redshifts, to date,
of these interesting objects, have not yet been determined. Attempts
to infer their redshifts from their colors combined with stellar population
models are highly uncertain at best. A recent analysis by Lanzetta
et al. (1996) argues that the reddest objects in the HDF have
z 6.
Clearly this requires spectroscopic confirmation which will be difficult
as the candidate galaxies are faint.
|
Figure 5-3: The Spectacular Hubble Deep Field showing approximately 1500 distant galaxies in a 2.5 x 2.5 arcminute field. Image courtesy of the HST Public Archive. |
In summary, the available data on the properties of high redshift galaxies and QSO absorption lines suggest the following:
 The initial stage of galaxy
formation ,defined as when the first generation
of stars is formed, occurred prior to z = 3 and is best identified
with the formation of spheroids (either elliptical galaxies or spiral
bulges). The formation of extended disks clearly takes a longer time
and was apparently very active between z = 1-2. Vogt et al. (1996)
show convincing evidence that objects with normal disk kinematics are
in place by z = 1. The presence of these
high redshift structures severely limits the amount of matter that
can be obtained in any HDM model.
The initial stage of galaxy
formation ,defined as when the first generation
of stars is formed, occurred prior to z = 3 and is best identified
with the formation of spheroids (either elliptical galaxies or spiral
bulges). The formation of extended disks clearly takes a longer time
and was apparently very active between z = 1-2. Vogt et al. (1996)
show convincing evidence that objects with normal disk kinematics are
in place by z = 1. The presence of these
high redshift structures severely limits the amount of matter that
can be obtained in any HDM model.
At z = 5 the universe
is 7% of its present age or .7 - 1.4
billion years. QSOs have been detected at this redshift so we know
that small-scale structure formation can occur on the 1 Gyr time scale.
Its possible that these distant QSOs are the manifestation of galaxy
formation and the formation of the first generation of stars. To
generate the QSO activity requires the presence of a massive black hole.
Possibly it is these massive black holes that have acted as the seeds
to attract additional baryonic material. In fact, the origin of these massive
black holes, 1 billion years after the birth of the universe is really
quite interesting. If they are the evolved remnants of massive star
clusters, then they obviously formed much earlier than z = 5.
The simple idea that a
protogalaxy would form the bulk of its
stars during the initial collapse is probably incorrect.
Over a dynamical timescale
(a few x 108 years for galactic potentials), if most of the gas
turns into stars then a star formation rate of 100-1000
M per year
would result. While such a large
star formation rate has been observed in some Ultraluminous IRAS
galaxies (see Sanders et al. 1988),
which are most likely the merger of two well formed galaxies,
there are no objects at high redshift yet identified that exhibit
this behavior. This is a strong argument that galaxy formation is
not a quick process, marked by a very large star formation rate (and
a very large supernova and metal-enrichment rate ), but perhaps is a
far more quiescent and longer process.
Indeed, detailed studies of elliptical galaxies
at z = 0 now strongly suggest that there is a range of ages in their
stellar populations and that their full formation occurred over
several billion years (see Rose et al. 1995).
per year
would result. While such a large
star formation rate has been observed in some Ultraluminous IRAS
galaxies (see Sanders et al. 1988),
which are most likely the merger of two well formed galaxies,
there are no objects at high redshift yet identified that exhibit
this behavior. This is a strong argument that galaxy formation is
not a quick process, marked by a very large star formation rate (and
a very large supernova and metal-enrichment rate ), but perhaps is a
far more quiescent and longer process.
Indeed, detailed studies of elliptical galaxies
at z = 0 now strongly suggest that there is a range of ages in their
stellar populations and that their full formation occurred over
several billion years (see Rose et al. 1995).
The role of feedback to the
galaxy formation process either
through supernova or the formation of QSOs is not yet well understood.
If the Universe has been completely re-ionized by QSOs, the observations
indicate that this occurred at z
5. Possibly this event served
to further delay the general process of galaxy formation.
The observations of Steidel
et al. that star formation in galaxies
was well in place by z = 3.5 is difficult to understand in CDM models
as this implies there was already small scale power by this redshift. Mo et al.
(1997) demonstrate that the presence of small scale power at this redshift
is greatly aided by non-zero  as the time per unit redshift interval is greater in this case.
The morphology of objects in
the HDF gives the strong visual
impression that galaxy formation is occurring via an assembly line process
in which small sub-units are being accreted into a larger entity. However,
these sub-units are already composed of gas and stars so some process
had to produce them at a much earlier epoch. Possibly, this process is
the one physical process that we understand - simple Jeans mass collapse
at high redshift. These (baryonic) sub-units then produce galaxies, via
merging, as they respond to the underlying mass distribution which is
dominated by dark matter. This is a potentially complex physical process
that will challenge our understanding.
Pairwise and Peculiar Velocities
The final small scale constraint which can be considered is the average
velocity and/or spatial separation between two random galaxies.
Peculiar velocities that might arise from gravitational interactions
between galaxies or between a galaxy and an overdense region such as
a cluster cause deviations from Hubble flow but do not alter the
position of the galaxy on the plane of the sky. Thus spatial correlation
functions that are performed in physical space which may be isotropic
become anisotropic when mapped onto redshift space (see discussion in
Kaiser 1987). The amount of anisotropy in redshift space can be measured
through the lower order moments of the peculiar velocity distribution.
For galaxy pairs, the first moment of the distribution,
v12 is
sensitive to the growth of the spatial or two-point correlation function.
The second moment  12
provides a direct measurement of
the kinetic energy of any random motions. In the equilibrium gas,
12 balances the
gravitational potential and hence can be
used to measure the effective mass. This is the situation in a cluster
of galaxies in hydrostatic equilibrium.
12
provides a direct measurement of
the kinetic energy of any random motions. In the equilibrium gas,
12 balances the
gravitational potential and hence can be
used to measure the effective mass. This is the situation in a cluster
of galaxies in hydrostatic equilibrium.
For standard CDM, normalized to give the observed power on small scales,
12 is predicted to
be
1000 km s-1. Open
models in which
 0
0.2 predict
12
500 km s-1. The
most recent
determination of 12
is based on a sample of 12,800 galaxies
that comprise a well-defined subset of the Northern and Southern Sky
Redshift surveys. The results (see Marzke et al. 1996) of this analysis
are unfortunately ambiguous:
0
0.2 predict
12
500 km s-1. The
most recent
determination of 12
is based on a sample of 12,800 galaxies
that comprise a well-defined subset of the Northern and Southern Sky
Redshift surveys. The results (see Marzke et al. 1996) of this analysis
are unfortunately ambiguous:
The measured
12 is 540 ± 180
km s-1. While
this is larger than the 1983 measurement of 340 ± 40 km
s-1 (see
Davis and Peebles 1983), it still does not effectively discriminate
between open and closed CDM models.
The samples are
"contaminated" by the presence of rich clusters
where 12 reflects
the cluster velocity dispersion which is significantly higher than
12 for field galaxies. This
"contamination" is severe. When galaxies which are thought to be members
of rich clusters are removed from the sample
12 lowers
significantly to 295 ± 100 km/s. In essence, this removal is accounting
for the most non-linear structures that are present and these aren't
necessarily a good probe of CDM structure formation scenarios. In this
case, it would seem that the open Universe CDM models are strongly favored.
The amount of
"contamination" depends on the volume of the
redshift survey. Local samples are biased against selecting galaxies
that are members of rich clusters and hence
12 is biased to
low values. This explains the low value originally measured by
Davis and Peebles. If one uses
the observed distribution of cluster velocity dispersions (see Zabludoff
et al. 1993), it is possible to estimate how big
a volume must be obtained in order for this "contamination" to not
be a dominant effect in the sample. Marzke et al. (1996) estimate the
required volume exceeds the volume of the existing redshift sample and
therefore no fair sample yet exists to properly measure
12.
Nevertheless, the indications are that
12 is relatively low and
the small scale velocity field is therefore mostly quiescent.
This quiesence would appear to rule out most of the explosion models
and the large scale hydrodynamic models of Cen and Ostriker (1994) .
Since those models introduce a non-gravitational component to the
peculiar velocity, they necessarily produce high
12.
However, one way to reduce
12 is via
galaxy-galaxy interactions and dynamical friction. Accounting for
the possible role of mergers appears to make the
12
measurements consistent with the predictions of high resolution
hydrodynamic simulation such as those of Zurek et al. (1994). If
this is true, however, the small scale clustering and dynamical
properties of galaxies would then be probing the evolution of
galaxy merging more than structure formation scenarios. A recent
analysis of the Canadian deep redshift survey finds strong evidence
for increased merger activity out to z
0.3 and derives
a merging rate that goes as (1 + z)2.9 ± 0.9,
consistent with the
expected (1 + z)3 dependence (see Patton et al. 1996).
In fact, the effects of merging, which means that the number density of galaxies as a function of redshift is not conserved, has serious implications on the use of small scale structure to constrain structure formation scenarios. This is because merging greatly modifies what is observed on small scales and leads to an overall decrease in the galaxy density on small scales if numerous small galaxies merger into one larger galaxy. Hence the pairwise velocity dispersion, the two point correlation function, and the amount of power on small scales could all be modified, by merging, from their original values. Such a signature, however, would be clearly detected as a strong redshift evolution of these quantities. At present, insufficient data exists to search for this signature.