

Since it first was presented ([29]), the Lyman-break technique had stood out as one of the most powerful tools for identifing high-z galaxy candidates. As of this writing, more than 550 candidates have been spectroscopically confirmed to be at z ~ 3 over an area ~ 0.3 square degrees and about 50 at z ~ 4 over an area ~ 0.23 square degrees ([31]). In number density, the bright ends of the z ~ 3 and z ~ 4 populations have similar values to the local L > L* galaxies, for a flat cosmology. Even if merging may have played a role in changing these values over time, just the number of stars contained in Lyman-break galaxies at z > 2 accounts for ~ 20-30% of all the stars known today. The basic fact is that the Lyman-break galaxy populations are a significant fraction of the total galaxy population today. Thus, understanding the nature of the Lyman-break galaxies remains a gateway to understanding the evolution of galaxies.
The identification of high-z candidates is based on the detection of the Lyman break at 912 Å, which is the strongest discontinuity in the stellar continuum of star-forming galaxies. A galaxy at, say, z = 3 will have the Lyman break redshifted to 3648 Å. If a pair of filters is chosen to straddle the break, the galaxy will appear extremely red in this color. In order to avoid as much as possible low-z interlopers, one or more filters are generally added longward of the Lyman break to select only candidates which are blue in this(these) additional color(s). With a careful selection of the color criteria, the Lyman-break technique is extremely successful at identifying high-z candidates; spectroscopic confirmations give a ~ 95% success rate for the z ~ 3 sample and a ~ 80% success rate for the z ~ 4 sample ([30], [8], [31]). The lower success rate at z ~ 4 is due to the incidence of low-z interlopers, namely elliptical galaxies at z ~ 0.5-1 whose 4,000 Å break falls inside the selection window of the filters.
While the determination of the intrinsic nature of the Lyman-break galaxies, whether they are massive systems or galaxy fragments, and what kind of progenitors they are, is still a source of heated debate (e.g., [21], [13], [1]), the identification of their observational low-z counterparts appears less controversial.
By selection, Lyman-break galaxies are UV-bright, actively
star-forming systems, with a preferentially blue spectral energy
distribution (SED). Observed star formation rates (SFRs) range from a
few to 50 M yr-1, for a Salpeter Initial Mass Function
(IMF) in the range 0.1-100 M
 ([8]). This
range of values is typical of what observed in Local, UV-bright
starburst galaxies (e.g.,
[4]). The restframe UV and
B-band half-light radii are around 0.2-0.3 arcsec, which correspond
to spatial radii ~ 1-3 h50-1 kpc,
depending on q0
([12],
[14]).
The similarity of the
half-light radii at both UV and B suggests that the UV is a reliable
tracer of the full extent of the light-emitting body. Ground-based
optical spectra, which correspond to the restframe 900-1800 Å range
for a z ~ 3 galaxy, show a wealth of absorption features, and
sometime P-Cygni profiles in the CIV(1550 Å) line (cf. the figures
in [30]),
typical of the predominance of young,
massive stars in the UV spectrum. Currently limited ground-based
near-IR spectroscopy (e.g.
[27]) has revealed nebular
line emission in these galaxies. Hybrid line equivalent widths
constructed using the UV flux density f(UV) as denominator, namely,
EW'(Å) = F(line)/f(UV), show that the observed values for the
high-z
galaxies fall in the loci observed for local starburst galaxies
([25]).
In summary, the observational properties
of the Lyman-break galaxy population fully resemble, in the restframe
UV-optical range, those of low-redshift, UV-bright starburst
galaxies
([25]).
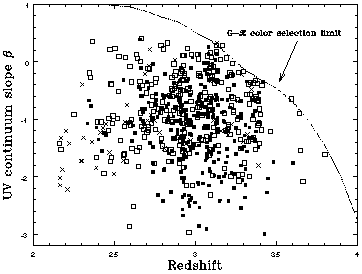
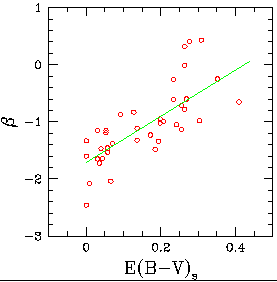
The Lyman-break galaxies share another global characteristic with the
Local starbursts. If we parametrize the observed UV stellar continuum
with a power law, F( )
)


 , Lyman-break
galaxies cover a large range of
  values, roughly from -3 to
0.4, namely from very blue to moderately red
(Figure 1, left
panel). This range is not very different from that covered by the
Local, UV-bright starbursts (Figure 1, right panel). Population
synthesis models (e.g.
[19]) indicate that a
dust-free, young starburst or constant star-formation population have
invariably values of
  < -2.0, for a vast range of metallicities.
What does cause the UV stellar continuum of Lyman-break galaxies
to be redder than expected for a young star-forming population?

|

|
Figure 1. (Left Panel) The
distribution of the observed UV
spectral indices |