


1.1. Basics of Quasar Spectra
Figure 1 illustrates many of the common features
of a quasar
spectrum. The relatively flat quasar continuum and broad emission
features are produced by the quasar itself (near the black hole and
its accretion disk).
In some cases, gas near the quasar central engine also
produces ``intrinsic'' absorption lines,
most notably Ly , and relatively
high ionization metal transitions such as C IV, N V, and O VI.
These intrinsic absorption lines can be broad [thousands
or even tens of thousands of km s-1 in which case the quasar
is called a broad absorption line (BAL) QSO], or narrow
(tens to hundreds of km s-1).
However, the vast majority of absorption lines in a typical
quasar spectrum are ``intervening'', produced by
gas unrelated to the quasar that is located along the
line of sight between the quasar and the Earth.
, and relatively
high ionization metal transitions such as C IV, N V, and O VI.
These intrinsic absorption lines can be broad [thousands
or even tens of thousands of km s-1 in which case the quasar
is called a broad absorption line (BAL) QSO], or narrow
(tens to hundreds of km s-1).
However, the vast majority of absorption lines in a typical
quasar spectrum are ``intervening'', produced by
gas unrelated to the quasar that is located along the
line of sight between the quasar and the Earth.
|
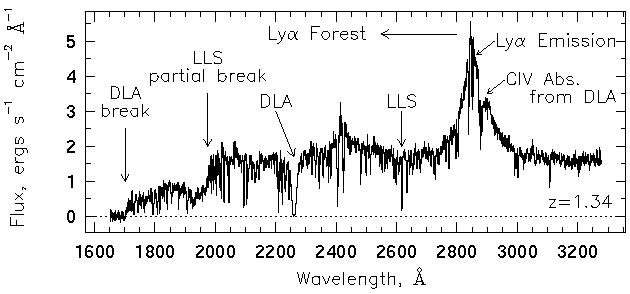
Figure 1. Typical spectrum of a quasar,
showing the quasar continuum and emission lines, and the absorption
lines produced by galaxies and intergalactic material that lie between
the quasar and the observer. This spectrum of the z = 1.34
quasar PKS0454+039 was obtained with the Faint Object
Spectrograph on
the Hubble Space Telescope. The emission lines at ~ 2400 Å and
~ 2850 Å are
Ly |
A structure along the line of sight to the quasar can
be described by its neutral Hydrogen column density, N(HI),
the number of atoms per cm2. N(HI) is given by the
product of the density of the material and the pathlength
along the line of sight through the gas. Each structure
will produce an absorption line in the quasar spectrum at a
wavelength of  obs =
rest (1 +
zabs), where
zabs is the redshift of the absorbing gas and
rest = 1215.67
Å is the rest wavelength of the
Ly transition.
Since zabs < zQSO, the redshift of
the quasar, these
Ly absorption lines form a
``forest'' at wavelengths
blueward of the Ly emission.
The region redward of the Ly
emission will be
populated only by absorption through other chemical transitions
with longer rest.
Historically, absorption systems with N(HI) < 1017.2
cm-2
have been called Ly forest
lines, those with
1017.2 < N(HI) < 1020.3 cm-2 are Lyman
limit systems,
and those with N(HI) > 1020.3 cm-2 are damped
Ly systems.
The number of systems per unit redshift increases dramatically with
decreasing column density, as illustrated in the schematic diagram
in Figure 2.
Lyman limit systems are defined by a sharp break in the spectrum
due to absorption of photons capable of ionizing HI, i.e.
those with energies greater than 13.6 eV.
The optical depth,
obs =
rest (1 +
zabs), where
zabs is the redshift of the absorbing gas and
rest = 1215.67
Å is the rest wavelength of the
Ly transition.
Since zabs < zQSO, the redshift of
the quasar, these
Ly absorption lines form a
``forest'' at wavelengths
blueward of the Ly emission.
The region redward of the Ly
emission will be
populated only by absorption through other chemical transitions
with longer rest.
Historically, absorption systems with N(HI) < 1017.2
cm-2
have been called Ly forest
lines, those with
1017.2 < N(HI) < 1020.3 cm-2 are Lyman
limit systems,
and those with N(HI) > 1020.3 cm-2 are damped
Ly systems.
The number of systems per unit redshift increases dramatically with
decreasing column density, as illustrated in the schematic diagram
in Figure 2.
Lyman limit systems are defined by a sharp break in the spectrum
due to absorption of photons capable of ionizing HI, i.e.
those with energies greater than 13.6 eV.
The optical depth,  , of the break
is given by the product
N(HI)
, of the break
is given by the product
N(HI)  , where the cross
section for ionization of Hydrogen,
= 6.3 x 10⁻¹⁸
(E
, where the cross
section for ionization of Hydrogen,
= 6.3 x 10⁻¹⁸
(E / 13.6 eV)-3 cm2,
(and the flux is reduced by the factor
e-).
The energy dependence of leads
to a recovery of the
Lyman limit break at higher energies (shorter wavelengths), unless
N(HI) >> 1017.2 cm-2 (see
Figure 1).
/ 13.6 eV)-3 cm2,
(and the flux is reduced by the factor
e-).
The energy dependence of leads
to a recovery of the
Lyman limit break at higher energies (shorter wavelengths), unless
N(HI) >> 1017.2 cm-2 (see
Figure 1).

|
Figure 2. The column density distribution of
Ly |
The curve of growth describes the relationship between the equivalent width of an absorption line, W, (the integral of the normalized profile) and its column density, N. Figure 3 shows that for small N(HI) the number of absorbed photons, and therefore the flux removed, increases in direct proportion to the number of atoms. This is called the linear part of the curve of growth. As N is increased the line saturates so that photons are only absorbed in the wings of the lines; in this regime the equivalent width is sensitive to the amount of line broadening (characterized by the Doppler parameter b), but does not depend very strongly on N(HI). This is the flat part of the curve of growth. Finally, at N(HI) > 1020.3 cm-2, there are enough atoms that the damping wings of the line become populated and the equivalent width increases as the square root of N(HI), and is no longer sensitive to b.

|
Figure 3. Illustration of the different
regimes of the curve of growth.
The middle panel shows the curve of growth for the
Ly |
In addition to the Ly
(1s -> 2p)
and higher order (1s -> np) Lyman series
lines, quasar spectra also show absorption due to different
ionization states of the various species of metals.
Figure 1 illustrates that the damped
Ly system at
z = 0.86 that is responsible for the
Ly absorption line at
obs = 2260 Å and
a Lyman limit break at
obs = 1700 Å
also produces absorption at
obs = 2870 Å due
to the presence of C IV in the absorbing gas at that same redshift.
Like many of the strongest metal lines seen in quasar
spectra, C IV is a resonant doublet transition due to
transitions from 2S1/2 energy levels to the
2P1/2
and to the 2P3/2 energy levels.
(The left superscript ``2'' represents the number of orientations of
the electron spin, the letter S or P represents the total
orbital angular
momentum, L, and the right subscript represents the total
angular momentum, J.)
Doublet transitions are easy to identify. The
dichotomy between rest wavelength and redshift is
resolved because the observed wavelength
separation of the doublet members increases as 1 + z.
Table 1 lists some of the metal lines that are commonly detected for intervening absorption systems. Many of these are only strong enough to be observable for quasar lines of sight that pass through the higher N(HI) regions of galaxies.
| Transition | rest [Å]
|
| LL | ~ 912 |
| Ly | 972.537 |
Ly | 1025.722 |
| Ly | 1215.670 |
| Si IV 1393 | 1393.755 |
| Si IV 1402 | 1402.770 |
| C IV 1548 | 1548.195 |
| C IV 1550 | 1550.770 |
| Fe II 2382 | 2382.765 |
| Fe II 2600 | 2600.173 |
| Mg II 2796 | 2796.352 |
| Mg II 2803 | 2803.531 |