

4.3. Angular momentum transfer
To minimize its total energy, a galaxy tends to concentrate its mass towards the center, and to transfer its angular momentum outwards (Lynden-Bell & Kalnajs 1972). It is the role of the spiral structure to transport angular momentum from the center to the outer parts, and only trailing waves can do it. This transfer, mediated by non-axisymmetric instabilities, is the motor of secular evolution of galaxies, and of the formation of bars and resonant rings.
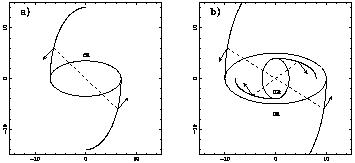
The angular momentum transfer is due to the torques exerted by the bar on the matter forming spiral arms. There is a phase shift between the density and the potential wells, resulting in torques schematized in fig 6. The gas is much more responsive to these torques, since they form the spirals in a barred galaxy. The torque changes sign at each resonance, where the spiral turns by 90°. Between the ILR and corotation, the torque is negative, while between CR and OLR, the torque is positive. These torques tend to depopulate the corotation region, and to accumulate gas towards the Lindblad resonances, in the shape of rings. Indeed, these rings then are aligned with the symmetry axis of the bar, and no net torque is acting on them. Numerical simulations of colliding gas clouds in a barred potential show that rings form in a few dynamical times, i.e. in a few Gyrs for the outer ring at OLR (Schwarz 1981), or in ~ 108 yr for nuclear rings at ILR (Combes & Gerin 1985).

|
Figure 6. Schematic representation of the gravity torques exerted by the bar on the gaseous spiral: a) between CR and OLR, the gas acquires angular momentum and is driven outwards; b) between CR and ILR, the gas loses angular momentum (cf Combes 1988). |
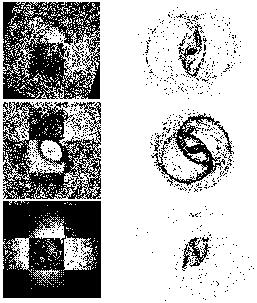
This mechanism for ring formation has been confirmed by many studies, and confronted to observations, where it always encounters large success. The potential is obtained from photometry of the galaxies in NIR bands, and derived with a small number of assumptions (usually constant M/L over the disk). The simulation of the gas flow in the potential allow the derivation of the pattern speed (cf Buta & Combes 1996, and fig 7).

|
Figure 7. Comparison of observed maps (top) and corresponding simulations (bottom) for NGC 6300 (left), NGC 3081 (middle) and NGC 1433 (right). For NGC 3081 and NGC 1433, the top images are B-I colors (blue is dark), and for NGC 6300 it is the H-band image (from Buta & Combes 2000). |