


I assume that the underlying active galactic nuclei (AGN) which power
the XRB have a quasar-like spectrum with an energy photon index of
one. The spectrum is then constant in a
 F sense
(Fig. 1).
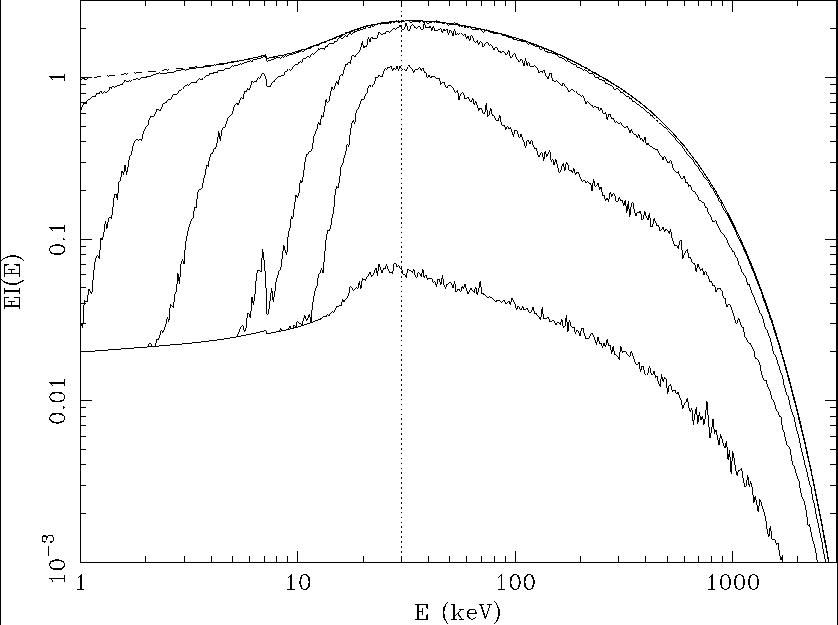
The action of photoelectric absorption by increasing amounts of
material, characterised by a column density NH, is
(Fig. 2) to cut
out the lower energy emission from the observed spectrum up to an
(approximate) energy E ~ 10 NH8/3
keV, where NH is in units
of 1024 cm-2. As the column density exceeds about
1.5 x 1024 cm-2 so the absorber becomes Compton
thick and Compton
(electron) scattering causes the residual spectrum above this cutoff
to decrease in intensity. This means that the intensity observed above
about 30 keV is close to the intrinsic unattenuated intensity from
Compton-thin sources, and is a lower limit for Compton-thick ones.
Therefore the intensity of the XRB at 30 keV equals the normalization
of the XRB after correction for absorption by Compton-thin sources.
This normalization can be increased by a factor of f-1
if only a
fraction f of all the power emerges from sources which are Compton
thin. f is at most 3/4
(Maiolino et al 1998)
and could be less than one half.
F sense
(Fig. 1).
The action of photoelectric absorption by increasing amounts of
material, characterised by a column density NH, is
(Fig. 2) to cut
out the lower energy emission from the observed spectrum up to an
(approximate) energy E ~ 10 NH8/3
keV, where NH is in units
of 1024 cm-2. As the column density exceeds about
1.5 x 1024 cm-2 so the absorber becomes Compton
thick and Compton
(electron) scattering causes the residual spectrum above this cutoff
to decrease in intensity. This means that the intensity observed above
about 30 keV is close to the intrinsic unattenuated intensity from
Compton-thin sources, and is a lower limit for Compton-thick ones.
Therefore the intensity of the XRB at 30 keV equals the normalization
of the XRB after correction for absorption by Compton-thin sources.
This normalization can be increased by a factor of f-1
if only a
fraction f of all the power emerges from sources which are Compton
thin. f is at most 3/4
(Maiolino et al 1998)
and could be less than one half.

|
Figure 1. XRB spectrum (solid line) with the assumed unabsorbed spectrum of photon index 2 (dotted line). A typical AGN spectrum with reflection, in which the direct emission is a power law of photon index 2 with an exponential cutoff of 300 keV is shown by the dot-dash line, matching around the XRB peak. If unabsorbed quasars contribute 50 per cent of the XRB at 1 keV, then their contribution lies along the bottom of the figure. |
The absorption-corrected XRB spectrum can then be extended into the
ultraviolet band assuming the mean quasar spectral energy distribution
of Elvis et al (1994).
This shows that about 3 per cent of the power
from a typical quasar is emitted in the 2-10 keV band. The total
absorption-corrected AGN background can now be converted into an
energy density  AGN and thence, through the use of
E = Mc2 or rather
(1 +
AGN and thence, through the use of
E = Mc2 or rather
(1 +
 )
=
)
= 
 c2
with an accretion efficiency factor
and a mean redshift
(since
photons lose energy in the expansion of the Universe but mass does
not), we have the mean density in black holes
bh.
c2
with an accretion efficiency factor
and a mean redshift
(since
photons lose energy in the expansion of the Universe but mass does
not), we have the mean density in black holes
bh.
|

|
Figure 2. Monte-Carlo simulations of of an accretion disc spectrum (a power-law of unit energy index with cold reflection and an exponential cutoff at 360 keV) propagated through a solar abundance spherical cloud of column densities ranging from 1021.25 to 1025.25 cm-2 in steps of a factor 10. Note that the spectra peak around 30 keV, indicated by the vertical line. The lower panel shows the effect of increasing the iron abundance by 5, which causes the peak to shift to 40-50 keV (from Wilman & Fabian 1999). |
The resulting value of bh = 6 x
105 M Mpc-3 is about half the value found by
Magorrian et al (1998)
from a study of ground-based optical data of
the cores of nearby galaxies, and in rough agreement with an HST
photometric study made by
van der Marel (1999).
Similar agreement has been obtained by
Salucci et al (1999)
from a detailed considerations
of source counts etc. This close agreement emphasises that most of the
mass in black holes has been accreted by a radiatively efficient (but
obscured) process, and not by some inefficient process such as an
advective flow. The correction required for absorption is extensive
and requires that most, about 85%, of the accretion power has been
absorbed.
Mpc-3 is about half the value found by
Magorrian et al (1998)
from a study of ground-based optical data of
the cores of nearby galaxies, and in rough agreement with an HST
photometric study made by
van der Marel (1999).
Similar agreement has been obtained by
Salucci et al (1999)
from a detailed considerations
of source counts etc. This close agreement emphasises that most of the
mass in black holes has been accreted by a radiatively efficient (but
obscured) process, and not by some inefficient process such as an
advective flow. The correction required for absorption is extensive
and requires that most, about 85%, of the accretion power has been
absorbed.