

The Lyman-break technique consists of a set of color criteria to
identify star-forming
galaxies at high-redshift through multi-band imaging across the 912
Å Lyman-continuum
discontinuity. At high redshifts (z
 2.5 for ground-based
telescopes and z
  2 for the
HDF) the Lyman limit is shifted far enough into the optical window -
into the U passband
in particular - to be detectable with broad-band photometry. By placing
filters on either
side of the redshifted break (see
Figure 1) one can identify
high-redshift objects by their
faintness in the U band and by an otherwise blue spectral energy
distribution. Using
redder passbands, the technique can be used to look for galaxies at even
higher redshifts.
For example, one can define similar criteria for B-band dropouts
which would be galaxies candidates at redshifts 3.5
 z
z
 4.5 and so on.
More details can be found in Mark Dickinson's contribution in this volume, who describes the Lyman-break technique applied to the HDF. Here we will simply review the salient features of the ground-based survey. For this, we have adopted a custom photometric system, named UnGR, optimized for selecting LBGs with redshifts around z ~ 3 (Steidel & Hamilton 1993). An initial selection region in the [G - R, Un - G] plane where to expect high-redshift candidates was identified based on the expected colors of moderately unreddened star-forming galaxies computed using stellar population synthesis codes (Bruzual & Charlot 1998, in prep.), and including the effects of the opacity of interstellar gas and intervening absorption by HI (Steidel et al. 1995; see also Madau 1995). Our selection criteria were subsequently verified and refined after extensive spectroscopy with the Keck telescopes.
An object is considered a Lyman-break galaxy if its colors satisfy

| (1) |
with an additional requirement
 < 25.5
imposed to produce a reasonably complete
sample that is suitable for spectroscopic follow-up (magnitudes are in
the AB scale of
Oke & Gunn, 1983).
Figure 1b shows an
example of the color diagram and selection window
that we have used to identify the high-redshift candidates. At the time
of this writing,
the ground-based survey consists of more than 1,200 U-dropouts
brighter than
  ~ 25.5,
of which 418 have been spectroscopically confirmed in the range 2 <
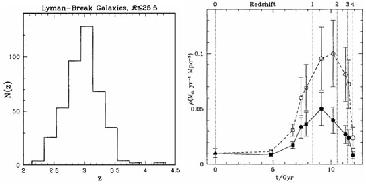
z < 4. Figure 2a
shows the redshift distribution N(z) of the current spectroscopic
sample. In comparison,
the HDF sample is significantly smaller, including 30 candidates with
V606 < 25.5, 22
of which have secured redshifts (see Dickinson's paper). However, it is
considerably
deeper, with 187 candidates at V606 < 27, a flux level
where its fractional completeness
is approximately equivalent to the ground-based sample. Unfortunately,
the redshift
distribution of this faint sample is empirically poorly constrained.

|
Figure 2. a) The redshift distribution
function N(z) of 418 LBGs obtained with the Keck
telescope and the LRIS spectrograph. The bin size is
|
As it turns out, the Lyman-break selection is particularly efficient to
single out
high-redshift galaxies from the deep counts, and we have found that at
least 75% of the objects
meeting the criteria of Eqn. (1) are indeed high-redshift galaxies. The
median value of the
redshift distribution in Fig. 2a is
 = 3.01 and the standard
deviation is
  z =
0.29, with
 90% of the objects having
redshifts in the range 2.4
 z
z
 3.6. About 5% of the objects
meeting these criteria are stars, essentially all brighter than
 ~ 24. The
remaining 20%
of objects remain unidentified because of the low S/N of their
spectra. However, it is
important to note that these are still consistent with being at
high-redshifts, either the
same as the confirmed galaxies or slightly smaller (e.g., 1.8
 z
z  2). Also, note
that our
success in obtaining a redshift has no obvious dependence on luminosity
or color.