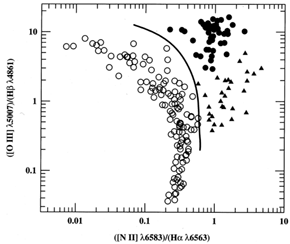
``Baldwin, Phillips & Terlevich'' (BPT) diagrams demonstrate how LINERs
can be distinguished from normal H II regions and normal AGNs (Seyferts
and QSOs) on the basis of their [O III]  5007 / H
 , [N II]
  6583 /
H
 , and
[S II]
 6716, 6731 / H
 flux ratios. Here it is seen that
the Seyfert 2s
have high values of each ratio. H II regions define a locus of lower
values which does not overlap with the region of parameter space
occupied by the Seyferts. The LINERs can be distinguished from the
Seyfert 2s by their low values of [O III]
  5007 / H
 relative to [N II]
 6583 / H
 , and from the H II regions by
their larger values of [N II]
 6583 / H
 .
.

|
Figure 2.3. A diagnostic (or BPT) diagram
for emission-line galaxies. The vertical axis is the [O III] |
Adapted from B.M. Peterson An Introduction to Active Galactic Nuclei, Cambridge University Press, (1997)