Seyfert galaxies are lower-luminosity active galactic nuclei, with MB > -21.51 + 5 log h0 for the active nucleus the generally accepted criterion, due originally to Schmidt & Green (1983), for distinguishing Seyfert galaxies from quasars. A Seyfert galaxy has a quasar-like nucleus, but the host galaxy is clearly detectable. The original definition of the class (Seyfert 1943) was primarily morphological, i.e., these are galaxies with high surface brightness nuclei, and subsequent spectroscopy revealed unusual emission-line characteristics. Observed directly through a large telescope, a Seyfert galaxy looks like a normal distant spiral galaxy with a star superimposed on the center. The definition has evolved so that Seyfert galaxies are now identified spectroscopically by the presence of strong, high-ionization emission lines. Morphological studies indicate that most if not all Seyferts occur in spiral galaxies
Khachikian & Weedman (1974) were the first to realize that there are
two distinct subclasses of Seyfert galaxies which are distinguished by
the presence or absence of broad bases on the permitted emission
lines. Type 1 Seyfert galaxies have two sets of emission lines,
superposed on one another. One set of lines is characteristic of a
low-density (electron density ne  103-106
cm-3) ionized gas with
widths corresponding to velocities of several hundred kilometers per
second (i.e., somewhat broader than emission lines in non-AGNs), and
are referred to as the ``narrow lines''. A second set of ``broad lines''
are also seen, but in the permitted lines only. These lines have
widths of up to 104 km s-1; the absence of broad
forbidden-line
emission indicates that the broad-line gas is of high density
(ne
  109 cm-3 or higher) so the non-electric-dipole
transitions are
collisionally suppressed. Type 2 Seyfert galaxies differ from Seyfert
1 galaxies in that only the narrow lines are present in type 2 spectra.
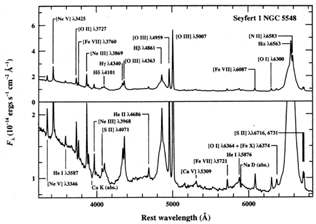
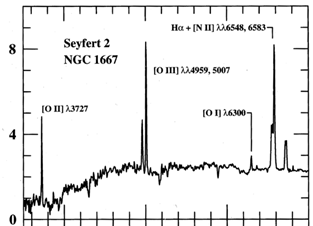
Samples of both a Seyfert 1 optical spectrum and a Seyfert 2 spectrum are shown below.

|
Figure 1. The optical spectrum of the Seyfert 1 galaxy NGC 1275. The prominent broad and narrow emission lines are labeled, as are strong absorption features of the host galaxy spectrum. The vertical scale is expanded in the lower panel to show the weaker features. The full width at half maximum (FWHM) of the broad components is about 5900 km s-1, and the width of the narrow components is about 400 km s-1. The strong rise shortward of 4000 Å is the long-wavelength end of the ``small blue bump'' feature which is a blend of Balmer continuum and FeII line emission. This spectrum is the mean of several observations made during 1993 with the 3-m Shane Telescope and Kast spectrograph at the Lick Observatory. Data courtesy of A. V. Filippenko. |

|
Figure 2. The optical spectrum of the
Seyfert 2 galaxy NGC 1667 is shown, with important emission lines
identified (Ho, Filippenko, and Sargent 1993). Some strong absorption
lines that arise in the host galaxy rather than the AGN itself are also
identified. This spectrum can be compared with the spectrum shown in
Figure 1. The units are: Wavelength (Å) for the x-axis and
F |
In addition to the strong emission lines, weak absorption lines due the late-type giant stars in the host galaxy are also observed in both type 1 and type 2 Seyfert spectra; the absorption lines are relatively weak because the starlight is diluted by the non-stellar ``featureless continuum''. Indeed, the AGN continuum is usually so weak in Seyfert 2 galaxies that it is very difficult to isolate it from the stellar continuum unambiguously.
The narrow-line spectra are clearly distinguishable from the
HII-region spectra seen in some normal galaxies, as the Seyfert
spectra show a wide range in ionization level, which is typical of a
gas ionized by a source where the input continuum spectrum falls off
slowly (relative to a Wien law) at ionizing wavelengths. A common, but
sometimes misleading spectroscopic criterion for distinguishing
Seyfert galaxies from HII-region galaxies is that the flux ratio
[OIII]  5007 / H
 > 3.
> 3.
The origin of the differences between Seyferts of type 1 and type 2 is not known. There are a few clear examples where galaxies have been identified as type 2 Seyferts because the broad components of the lines have proven to be very hard to detect. One school of thought holds that all Seyfert 2s are intrinsically Seyfert 1s where we are unable to see the broad components of the lines from our particular vantage point. It is not clear, however, that this hypothesis can explain all of the observed differences between the two subclasses.
Osterbrock (1981) has introduced the notation Seyfert 1.5, 1.8, and
1.9, where the subclasses are based purely on the appearance of the
optical spectrum, with numerically larger subclasses having weaker
broad-line components relative to the narrow lines. In Seyfert 1.9
galaxies, for example, the broad component is detected only in the H line, and not in the higher-order Balmer lines. In Seyfert 1.8
galaxies, the broad components are very weak, but detectable at H
 as
well as H
 . In Seyfert 1.5
galaxies, the strengths of the broad and
narrow components in H
 are comparable. Caution must be exercised in
using this subclassification of Seyfert 1 spectra; whereas the
statistics of occurrence might conceivably have some bearing on
unification issues, there are some cases in which broad emission-line
variability is so pronounced that the subclassification changes with
time. Indeed, there have been cases reported where the broad lines in
Seyfert 1 galaxies have nearly completely disappeared (e.g., Penston &
Perez 1984) when the nucleus has faded to a very faint state. Based
on casual inspection, the source would have been classified as a
Seyfert 2 galaxy. However, close examination of the spectra seems to
indicate that the broad lines never completely disappear.
Adapted from B.M. Peterson An Introduction to Active Galactic Nuclei, Cambridge University Press, (1997)