Copyright © 1991 by Annual Reviews. All rights reserved
| Annu. Rev. Astron. Astrophys. 1991. 29:
543-79 Copyright © 1991 by Annual Reviews. All rights reserved |
In a given galaxy, the number of globular clusters per unit
magnitude interval,  (m)
(or
  (M) in absolute
magnitude), is the luminosity
function or GCLF of the cluster system.
The GCLF is the visible manifestation of the cluster mass
spectrum, and must result from both the
initial mass function of cluster formation and its
subsequent long-term erosion by various dynamical processes
(see Section 7).
The GCLF data now available for several galaxies show that
 (m) can be simply and
accurately described by a Gaussian distribution,
where A is the simple normalization factor representing the
total population Nt, m0 is the mean
or peak (turnover)
magnitude of the distribution, and
To first order, GCLFs in different galaxies can then be compared through
the two parameters M0 (the absolute magnitude of the
turnover) and
a Observations in B for the giant E galaxies have been
converted to V assuming (B - V) = 0.8. Distance moduli are
as in Table 1.
For the more distant galaxies in Table 2,
the turnover levels are faint (B0
Figure 1 demonstrates that over a broad range of
systems, the turnover luminosity MV0 is
evidently nearly independent
of parent galaxy size, environment, or (to within ± 0.3 mag),
reasonable changes in the adopted distance scale H0
(see 96). An
unweighted mean for all the
galaxies in Table 2 yields <
MV0 > = -7.1
with an rms scatter of ± 0.43 mag. For the 10 largest
galaxies, we obtain < MV0 > = -7.27 with a
± 0.23-magnitude scatter. For M / LV
Historically, strong interest in GCLFs has
accompanied their use as distance indicators.
Hanes (79,
80) reviewd
their early development as standard candles, and thorough recent discussions
can be found in Hanes & Whittaker (84), Harris
(98), and Harris
et al. (103).
In brief, for a distant galaxy one needs to obtain photometry
of the globular clusters to a level approaching the turnover.
Various numerical techniques can then be
used to fit a model like Equation 1 to the observed GCLF and thus to
deduce m0 and
With the best current ground-based imaging capabilities (subarcsecond
seeing and Vlim
Another useful feature of the cluster distribution
in well populated systems is a function that I denote
(Because of the Gaussian fitting function, the last term in
Equation 2 resembles a Malmquist correction factor).
With
Note that m1 represents the magnitude
level at which the clusters contribute the most total light
as the result of their relative
numbers and individual luminosities.
(1)
The
 (m) dm =
A exp[-(m - m0)2 / 2
  2] dm
2] dm
 is the dispersion. This log-normal function is introduced
purely as an empirical match to the real GCLF and as a convenient way to
compare different galaxies. It is, however, an extremely
successful match to the actual data; no significant departures
from a strictly Gaussian form have been found
even in samples corresponding to Nt
  2000 clusters
(see 18,
71,
78,
88,
103,
108,
206). Whatever
the true underlying form of
 (M) is, it must
closely resemble Equation 1.
 . Estimates of
these for all galaxies to date in which photometric surveys have reached
clearly to the turnover point are summarized in
Table 2 and
Figure 1. In Table 2,
<MV> is the turnover level in absolute visual
magnitude,
  (M0) is the estimated GCLF dispersion, and
<[Fe/H]> is the mean metallicity of the clusters.
For the smaller Local Group members, MV0 is
simply the mean over all clusters and
  (MV) is the
rms dispersion around the mean; for the larger galaxies, both
MV0 and
  are obtained by fitting Equation 1 to the
observed GCLF (see 103).
Galaxy
<MV>a
 (MV)
(MV)
<[Fe/H]>
Sources
Fornax dE
-7.06 ± 0.42
0.95
-1.85 ± 0.14
21,
22,
226a
N147
-5.99 ± 0.92
1.8:
-2.05 ± 0.4
45,
108
N185
-6.49 ± 0.71
1.42
-1.65 ± 0.25
45,
108
N205
-7.27 ± 0.27
0.72
-1.45 ± 0.10
45,
108
LMC
-7.51 ± 0.32
0.96
-1.66 ± 0.1:
72a,
108,
201a
M33
-7.01 ± 0.17
1.17
-1.40 ± 0.2
21,
37
Milky Way
-7.36 ± 0.17
1.28
-1.35 ± 0.05
5,
103,
225
M31
-7.4 ± 0.5:
1.2:
-1.21 ± 0.05
21,
54
N1399
-7.3 ± 0.3
1.4
-0.85 ± 0.1
18,
71
N3031
-1.46 ± 0.31
21
N3377
-7.05 ± 0.6
1.2:
100
N3379
-7.59 ± 0.4
1.2:
100,
169
N4365
-6.95 ± 0.18
1.58
103
N4406
-6.9 ± 1:
1::
38,
98
N4472
-7.40 ± 0.11
1.50
-0.8 ± 0.3
103,
152
N4486
-7.32 ± 0.13
1.70
-1.0 ± 0.2
21,
39,
103,
152,
217
N4649
-7.45 ± 0.14
1.29
-1.1 ± 0.2
40,
103
N5128
1.35
-0.84 ± 0.1
85,
88
 24.7 at Virgo) and
require limiting CCD photometry to establish the levels unambiguously.
For the Local Group members, different but equally
challenging problems have plagued this subject.
In the dwarf ellipticals, the cluster samples are complete but
unavoidably tiny. In the LMC and SMC, the samples are small
but may also still be slightly biassed toward brighter objects,
while in M33, both faint-end incompleteness and accidental
inclusion of red intermediate-age clusters are likely problems.
With M31,
we encounter a uniquely frustrating morass of
observational and interpretive difficulties involving
combinations of sample
contamination, large and uncertain reddening corrections for
the many clusters projected on the M31 disk, and a highly
nonuniform photometric database.
These have eventually led to unquantified
biasses in all attempts to extract the true GCLF: compare the
discussions by Racine & Shara (174), Crampton et al. (41), van
den Bergh (206), Sharov & Lyutyi (90), Racine
(171a), as well
as the error analyses by Battistini et al. (8),
Elson & Walterbos (54), and van den Bergh (211).
Nevertheless, new radial velocity measurements and precise
multicolor photometric indices from CCD imaging are finally
putting a complete, accurate, and nearly uncontaminated
database within reach for this important galaxy.
 2, this
luminosity corresponds to a characteristic mass 1.4 x
105 M
 . The intrinsic dispersion
  may
be systematically a bit larger for the giant ellipticals
(for which the best
functional fits are reached consistently at
 1.4) than for the other systems (for which
 1.2 seems preferable), though the difference has been hard to
establish and is not yet definitive.
Figure 2 shows some specific illustrations.
In essence, globular cluster
luminosities follow basically similar distributions everywhere
we have looked: The data in Table 2 now represent
every type of host
galaxy and span almost the full known range of galaxy
size (10 magnitudes in MVT). This uniformity
is all the more remarkable when we consider that
Figure 1 may represent at least three
distinguishably different
processes of galaxy formation (dwarf ellipticals, giant
ellipticals, and the spheroids of disk galaxies)
as well as a large range of dynamical erosion mechanisms.
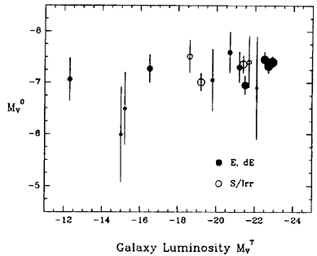
Figure 1. Mean globular cluster luminosity as a
function of parent galaxy size, with data from
Table 2. MV0 is the
average or turnover luminosity of the clusters in each galaxy. Smaller symbol
sizes denote more uncertain mean values, as indicated by the error bars.
 . Putting in the true
luminosity M0 then immediately gives the distance modulus of
the system. A practical problem is often that
the data do not reach clearly past the turnover, in which case
the solutions for m0 and
  become
correlated. In such cases one must assume a standard value
for
  and solve only for
m0. For any reasonable
choice of distance scale H0, the first-order universality of
M0 is already clear [see Figure
1 above and Harris (96)]. However,
it is not yet known at the second-order (
 0.3-mag) level
just how much M0 may vary randomly, or change
systematically with the type of the parent
galaxy (in particular, from the large
disk galaxies to the large ellipticals). Settling this issue
is crucial to calibrating GCLFs self-consistently.
 25), the fiducial level M0 will be
directly detectable for galaxies as distant as ~ 30 Mpc; with
space-based imaging at 0."1 resolution,
this limit can be extended to ~ 100 Mpc, i.e.
about four magnitudes more distant than the Virgo Cluster.
Some suggestions (16,
84) are that the
very top end of the GCLF may itself be used as a
more approximate standard candle to reach even further out:
In a typical giant elliptical galaxy, the well-filled
bright end of the
  (m)
curve (see the right panel of Figure 2)
falls off so steeply that the
magnitude level of the brightest clusters is insensitive to
the total population Nt. Preliminary consistency tests
of this idea have been made at the ± 0.5-magnitude level
for the distant GCSs in Coma
(95,
194) and NGC 6166
(168). Because the
brightest globulars lie at MV
  -11,
the ultimate limits of GCS detectability
may approach ~ 500 Mpc with large telescopes from space.
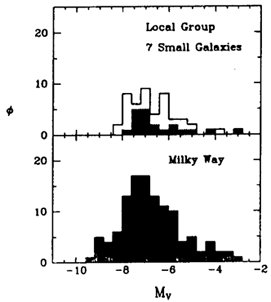
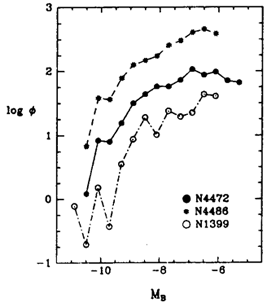
Figure 2. Two different representations of GCLFs.
(Left) The number  of
globular clusters per
0.4-magnitude bin is plotted for 118 clusters in the Milky Way
with known luminosities (lower panel), and for a total of 48
clusters in 7 small Local Group galaxies that have been rather
arbitrarily lumped together (upper panel). In the upper
graph, the shaded region shows the sum of the four dE systems
NGC 147, 185,
205, and Fornax, while the unshaded region adds
the LMC, SMC, and M33. (Right) GCLFs for three giant E
galaxies. Note that (log
  ) is
now plotted, and
the scale is arbitrary since
the three curves have been shifted vertically for clarity.
 (m) and call the
luminosity-weighted luminosity function (LWLF),
defined as
  (m) dm =
l (m)
 (m) dm. Here
l (m)
  const. x
10-0.4 m
is the luminosity corresponding to magnitude m, and
(as before)
  (m) dm
is the number of clusters in the interval (m, m + dm).
If
  is described by a Gaussian
curve with a peak at m0 and a dispersion
  ,
then it may easily be shown that the function
  is also a Gaussian with the same dispersion
  , but that
it reaches a maximum at m = m1, where
 2 ln 10

 1.4 mag,
m1 is almost exactly 2 magnitudes brighter than
m0.
 (m) curve can be
fitted to the data in just the same way as the number
distribution
  (m), but
with the advantages that
its turnover is quite a bit brighter and that it
is insensitive to the details of the faint end of the
cluster distribution because the clusters there contribute little
total light. Numerical tests on the
Virgo
galaxy sample show that for the same data, both
m0 and m1 can be estimated with
similar precision as
long as the bright end of the LF is well populated. Thus
for large E galaxies, more distant than Virgo where the GCLF
turnover may be too faint to reach clearly, it can be
more convenient to work with the LWLF instead.
Figure 3 illustrates the two functions.
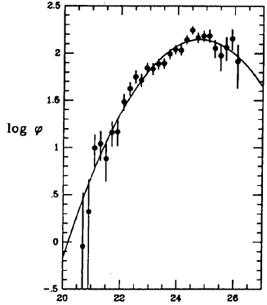
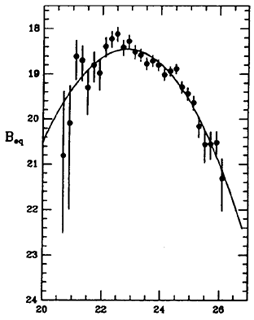
Figure 3. Luminosity distributions for the globular
cluster systems around the giant Virgo ellipticals, from
Harris et al. (103). The four galaxies NGC 4365, 4472, 4486,
and 4649
are directly summed to form a single composite
distribution. In the left panel, the GCLF is plotted
as the number of globular clusters found per
0.2-magnitude interval. In the right panel, the LWLF
(luminosity-weighted luminosity function, as defined in the
text) is plotted. Here Beq
(= constant - 2.5 log  ; see
Section 3) is the integrated
magnitude of all clusters in each 0.2-magnitude bin.
For each function, a best-fitting Gaussian curve with
dispersion
  = 1.4
magnitudes is drawn through the
points. Note that the LWLF peaks at a point almost exactly 2
magnitudes brighter than the GCLF does.
1 These totals
are clearly dominated by the relatively few but very bright clusters
near the top end of the distribution: For example, it is striking to
realize that the single cluster  Centauri contains about
8% of all the globular cluster light in the Milky Way.
Back.