Copyright © 1989 by Annual Reviews. All rights reserved
| Annu. Rev. Astron. Astrophys. 1989. 27:
139-59 Copyright © 1989 by Annual Reviews. All rights reserved |
Recent detailed studies of galaxies have shown that even the fairly elaborate representation of Figure 3 is not adequate to address the newfound differences among galaxies' stellar populations. In particular, it is found that the rate of star formation as a function of time is not simple, nor is it common to all galaxies, even those of the same Hubble type. For example, the Sculptor and Fornax galaxies, both classified as dwarf ellipticals (sometimes the term ``spheroidal'' is used for what are now irrelevant historical reasons), cannot be characterized as having similar populations of stars. Sculptor seems to consist entirely of stars of great age (about 15 Gyr) but with a range in heavy-element abundances (29). Fornax, on the other hand, while also showing a range in heavy-element abundances, seems to show a somewhat greater mean enrichment and has a significant population of intermediate-age stars (20, 39). Thus, there seem to be three important variables, somewhat interconnected, that determine the stellar population of a galaxy: time, abundances, and the star formation rate.
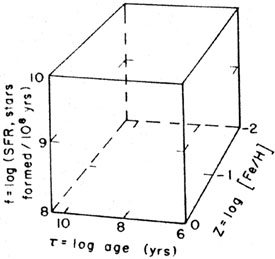
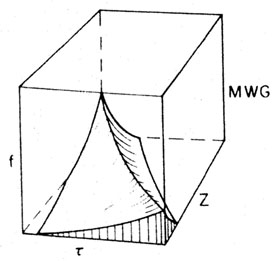
To illustrate population differences for different galaxies, I have chosen to use a three-dimensional representation, as defined in Figure 5, with the three axes being the ages of the stars, their heavy-element abundances, and the star formation rates. For the schematic population box diagrams that are given in the next section, I plot the logarithms of these parameters, with the range in values dictated by observation, as given in Figure 5.
|
Figure 5. The population box. |
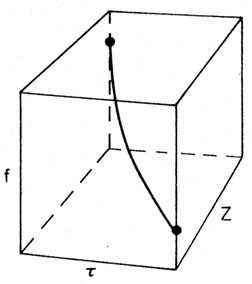
Figure 6 gives an example of what a very simple galactic history would produce. In this ease, the line in the box shows that the galaxy began star formation abruptly about 15 Gyr ago and then formed stars at a steadily decreasing rate as the interstellar raw materials were used up. As time progressed, the chemical abundances of the material in the stars that formed gradually changed as stellar evolution produced increasing amounts of heavy elements. Of course, this is an unrealistic example, because a real galaxy would not be able to maintain a perfectly uniform enrichment history, nor would star formation necessarily proceed perfectly smoothly.
|
Figure 6. A simple galactic history plotted in the population box. |
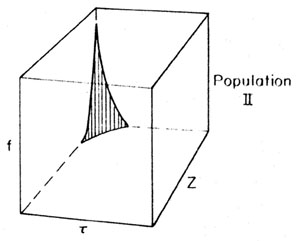
Another simple example is given in Figure 7, which represents the classical view of a Population II galaxy. Most of the star formation took place in an initial burst, and very little heavy-element enrichment had time to occur in this galaxy.
|
Figure 7. The volume occupied in the population box by a traditional Population II galaxy. |
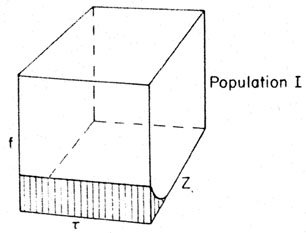
A further simple example of a population box is Figure 8, which represents a somewhat unphysical pure Population I galaxy, which has had a uniform rate of star formation since it was formed, and whose abundances are and have been approximately solar.
|
Figure 8. The volume occupied in the population box by a (non-physical) pure Population I galaxy. |
A final example is given in Figure 9, which shows a highly schematic picture of the population characteristics of the MWG. The surface in the box indicates that stars formed in an initial burst at a high rate at low-Z values, and then that star formation continued at a slowly decelerating rate, with Z gradually but not uniformly increasing to the present value. This very uncertain and schematic treatment of the Galaxy is the only inclusion of it in this review; in the following, only the other Local Group members are discussed in any detail.
|
Figure 9. A schematic version of the MWG's volume in the population box. |