

People sometimes think of irregular galaxies as being peculiar. However, Magellanic-type irregular (Im) galaxies are, for the most part, ordinary disk galaxies. Like most disk galaxies, including their cousins the spirals, irregulars contain old stars, frequently young stars and H II regions, both neutral atomic and molecular gas, and some dust and heavy elements. What defines this morphological class of galaxies is the lack of spiral arms and the symmetry that spiral arms impose on disk systems. The result is an irregular appearance, but it is just this lack of spiral arms that makes the irregular galaxies useful as laboratories for the study of star formation. Without spiral density waves to act as a triggering mechanism for gas cloud formation, and hence star formation, the irregular galaxies enable us to investigate all of the other factors that enter into the star formation process and which might otherwise be hard to disentangle from the spiral density wave. Thus, irregular galaxies are very useful systems for probing star formation processes, and hence this review is focussed on key issues concerning the nature of the star formation process in these systems. I am building on earlier reviews of star formation and other galactic properties of irregulars (see, for example, Roberts 1969, Hodge 1971, Gallagher & Hunter 1984, Hunter & Gallagher 1986, and references therein).

| 
|

| 
|
| 
|
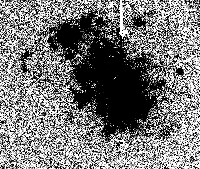
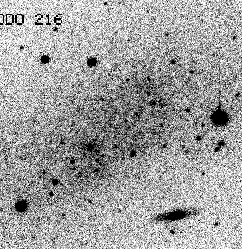
In many ways the Im galaxies are an extension of the Hubble sequence of spirals and a natural follow-on to the Sm galaxies, and a few Im galaxies are illustrated in Figure 1. The Im galaxies are defined by their lack of organized structure; the Sm galaxies are the class of spirals in which spiral structure can just barely be identified. In addition to morphological differences, however, the Im galaxies are distinguished from spirals in terms of other global properties. As a class, irregulars are bluer, smaller, less luminous, less massive, more gas-rich, lower in metallicity, and less dusty. Because of the high gas content and low abundances of heavy elements, irregulars are thought of as being less evolved than spirals in the sense that less of their interstellar medium (ISM) has been converted into and processed through stars. A comparison of the distribution of integrated colors of a sample of irregular and spiral galaxies is shown in Figure 2, luminosity in Figure 3, linear diameter in Figure 4, the width of the integrated hydrogen profile (related to the mass of the galaxy) in Figure 5, and overall surface brightness in Figure 6. Bothun et al. (1993) also offer the intriguing suggestion that the disks of low surface brightness galaxies, of which the irregulars are a sub-group, formed over a longer period of time than was characteristic of the higher surface brightness spirals and that star formation rates over all have been lower because these galaxies have lacked external stimulations. In that case, important characteristics of irregular galaxies that we see today could be a result of their relative isolation.
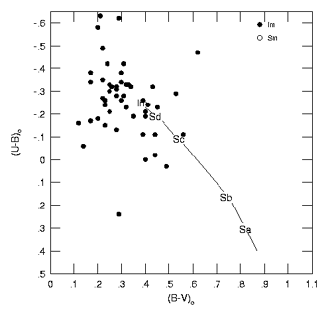
Figure 2. Integrated colors of galaxies. Although there is a range of colors in any morphological class, for clarity only the average colors are shown for spiral galaxies (de Vaucouleurs & de Vaucouleurs 1972). The data for irregular galaxies are taken from RC3 and corrected for foreground Milky Way reddening according to Burstein & Heiles (1984), an assumed internal reddening of E (B - V) = 0.1, and the reddening curve of Schild (1977). |
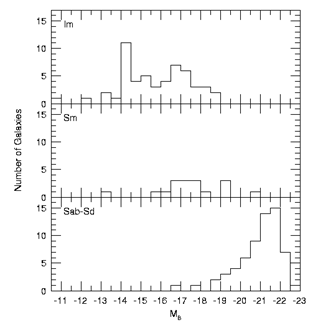
Figure 3. Distribution of integrated absolute magnitude of galaxies. The sample of galaxies are the same as in Figure 2, and the data are corrected for reddening in the same way. The internal reddening of the spiral galaxies is assumed to be E (B - V) = 0.3, and the distances that are not known from other means are determined from VGSR and a Hubble constant of 65 km s-1 Mpc-1. The apparent integrated B magnitudes and VGSR come from RC3. |
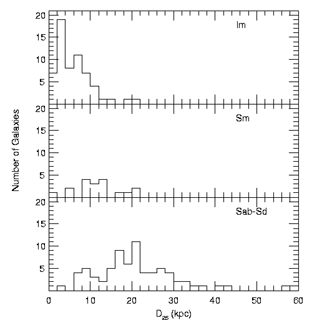
Figure 4. Distribution of linear diameters of the galaxies within a surface brightness of 25 magnitudes per arcsec2 (RC3). |
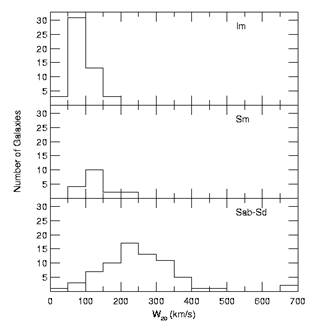
Figure 5. Distribution of full width at 20% of peak intensity of the integrated H I line profile. This is related to the total mass of the galaxy - stars, gas, and dark matter, a broader width implying more mass. Data are from Fisher & Tully (1981), Bottinelli et al. (1982), Hunter & Gallagher (1985c), Allsopp (1978), Carignan & Beaulieu (1989), and Hunter et al. (1982). |
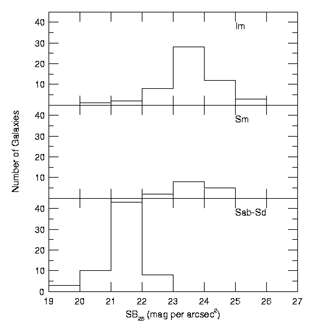
Figure 6. Distribution of integrated surface brightness within the 25 magnitude arcsec-2 contour (RC3). |
When I talk about irregular galaxies in this review, I am
primarily discussing a sample of some 60 relatively
nearby (D  27 Mpc) Im
galaxies. Galaxies were selected to contain gas
(Fisher & Tully 1975,
1981), and hence have the
potential to be star-forming.
In addition these galaxies are chosen to be relatively isolated; any galaxy
known to be interacting is excluded. The reason
for this restriction is that we wish to investigate internal
processes, and interactions between galaxies introduce external
factors that are hard to disentangle from internal ones.
Sadly, this means that the Magellanic Clouds, the galaxies that
originally defined the Im (Magellanic-type) class are
excluded because they are interacting with each other and
with the Milky Way. However, because of their proximity we will find
that we need to call on these galaxies for detailed studies of
individual star-forming regions or clusters even though any global
characteristics, especially star formation histories, are suspect.
When I compare the Im galaxies to spiral galaxies, the spirals
are taken from the sample of Kennicutt (1983). Kennicutt's sample
includes 170 nearby field and Virgo cluster galaxies spanning the range of
normal spiral morphological types. I also include a sample of 16 Sm
galaxies, and morphological classifications are taken from RC3
(de Vaucouleurs et al. 1991).
For galaxies without more direct distance determinations, the distances
are determined from VGSR, taken from RC3, and a Hubble
constant of 65 km s-1 Mpc-1.
If we are going to discuss star formation, we need first to find
a way to trace the current star formation activity so that we
can determine just what star formation is going on in these galaxies today.
There are a number of ways that have been employed to do this, but the
simplest tracer is H emission. The prodigious output of ultraviolet
photons from massive stars ionizes the gas leftover from the
cloud from which the stars have just formed. For a given stellar
initial mass function (IMF), one knows the average output of ionizing
photons per star, so the H
 luminosity tells you how many massive
stars have recently been formed. Here ``recently'' is the last
few to ten Myrs. If one then also assumes that lower mass stars have
also formed according to the proportions dictated by the same IMF
and assume a time scale for the lifetime of the H II regions, one
can deduce the current rate at which gas is being turned into stars in
the galaxy in M
 yr-1. H
 images of a few irregular galaxies are shown in
Figure 1 and more can be found in the literature
(see, for example, Hodge 1969;
Hunter 1982;
Hunter & Gallagher 1985b;
Hunter, Hawley, & Gallagher
1993; Hodge et al.
1994); these images show
the distribution of the youngest star-forming regions in the galaxies.
However, since galaxies come in a wide variety of sizes, to compare different galaxies one has to normalize the star formation rate to some measure of the size or mass of the galaxy; the requirement being that it be some global quantity that will not change much with time as the galaxy evolves. The total galactic mass is an obvious choice, but it is entangled in the issue of dark matter and determining the luminous mass alone is fraught with uncertainties. Therefore, I use the physical size of the galaxy as a normalization for the star formation rate. In this review I use the area within D25, the diameter of the galaxy measured to a B surface brightness of 25 magnitudes per arcsec2 (taken from RC3).
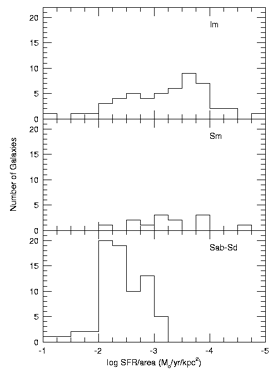
Figure 7. Distribution of integrated star formation rates normalized to the area of the galaxy within a surface brightness of 25 magnitudes per arcsec2. The rates are determined from H  luminosities as described in the
text and assuming a Salpeter
(1955) IMF from 0.1 to 100
M luminosities as described in the
text and assuming a Salpeter
(1955) IMF from 0.1 to 100
M .
H .
H luminosities for spiral
galaxies are from Kennicutt (1983). luminosities for spiral
galaxies are from Kennicutt (1983).
|
Global star formation rates measured from H images and normalized in the manner
just described are shown in Figure 7.
The H
 luminosities of the
irregulars have been corrected for foreground and internal extinction
assuming an internal E (B - V) of 0.1 when not otherwise known;
for spirals a value of 0.3 was used as adopted by
Kennicutt (1983).
In Figure 8 is shown the time scale for these galaxies
to exhaust their current total gas supply if they keep forming stars
at their current rate. The gas supply is taken to
include H I, He (34% of H I), and H2. The H2 mass
is taken to be 20% times the H I mass for irregulars. This represents a
very rough value determined by averaging global ratios for
NGC 4449
(Hunter & Thronson 1996), the
SMC (Rubio et
al. 1991), and the LMC (Cohen et
al. 1988). For spiral galaxies the H2 masses are
given by Kennicutt et al.
(1994) for the galaxies in their sample
or assumed to be equal to the H I mass. One can see from the figure
that most irregular galaxies can comfortably continue forming
stars at their current rates for many Hubble times to come
(but see also Sandage 1986).
This does not take recycling of gas into account. That is, stars return
some fraction of themselves to the ISM in the form of winds and ejecta when
they die. According to Kennicutt
et al. (1994), recycling can
increase the timescale to exhaust the total gas supply by factors of
1.5 to 4.
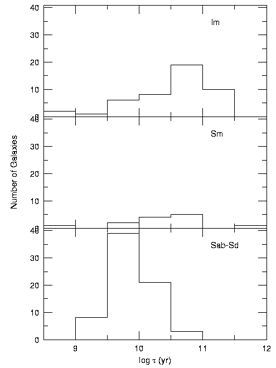
Figure 8. Distribution of timescale to exhaust the total current gas supply if formed into stars at the current rate. The gas is taken to be H I + He + H2, as described in the text. Recycling of material from stars back to the ISM is not included, but is expected to increase the timescale by factors of 1.5-4 (Kennicutt et al. 1994). H I data for irregulars are from Allsopp (1978), Fisher & Tully (1981), Hunter & Gallagher (1985c), Bottinelli et al. (1982), and Carignan et al. (1989). Data for spirals are from Fisher & Tully (1981) and Bottinelli et al. (1982). |
There are several interesting things to see in Figure 7. First, some irregular galaxies have star formation rates per unit area that are comparable to those of spiral galaxies. Absolute rates are lower because Im galaxies are smaller galaxies, but relative to their size these Im galaxies are just as actively forming stars. This means that spiral density waves are not necessary for active star formation (Hunter, Gallagher, & Rautenkranz 1982). In fact over the past decade or two the concept of the role that density waves play in triggering star formation in spiral galaxies has undergone revision as well (see, for example, Larson 1988, Elmegreen 1992).
Secondly, among the irregulars themselves, there is a range of
four orders of magnitude in star formation rates. At the high end
in this histogram is NGC 1569, which is undergoing a true wide-scale
burst of star formation involving most of the optical galaxy
(Gallagher, Hunter, & Tutukov
1984; Israel 1988).
The second highest star formation rate belongs to
IC10, another galaxy with an unusually elevated
global star formation
rate (Massey & Armandroff
1995). The reasons for
the sudden intense star formation activity in these two galaxies are
not known but interactions with other galaxies are not apparent.
Below these galaxies in star formation rate are systems like
NGC 4449 that
are actively forming stars but that are not undergoing starbursts -
meaning an unusually enhanced global star formation rate relative
to the past activity. From there the star formation rates decrease
down to systems like DDO 216 with the lowest rate in this sample.
Curiously, of all the Im galaxies that I have imaged at H only
two have not contained any detectable H II regions.
However, this large range in star formation rates among Im galaxies
leads naturally to the first question that I want to discuss.