


The census of BH candidates as of January 2000 is given in Table 1. The table is divided into three groups - detections based on stellar dynamics, on ionized gas dynamics, and on maser disk dynamics (top to bottom). The rate of discovery is accelerating as HST pursues the search. However, we already have candidates that span the range of predicted masses and that occur in essentially every type of galaxy that is expected to contain a BH. Host galaxies include giant AGN ellipticals (the middle group), Seyfert galaxies (NGC 1068), normal spirals with moderately active nuclei (e.g., NGC 4594 and NGC 4258), galaxies with exceedingly weak nuclear activity (our Galaxy and M 31), and completely inactive galaxies (M 32 and NGC 3115).
| Galaxy | Type | D | MB, bulge | MBH | log 
|
| (Mpc) | (M ) ) | ||||
| Galaxy | Sbc | 0.0085 | 17.65 | 3 x 10⁶ | -3.62 |
| M 31 | Sb | 0.7 | 18.82 | 3 x 10⁷ | -3.31 |
| M 32 | E | 0.7 | 15.51 | 3 x 10⁶ | -2.27 |
| NGC 3115 | S0/ | 8.4 | 19.90 | 1 x 10⁹ | -1.92 |
| NGC 4594 | Sa/ | 9.2 | 21.21 | 1 x 10⁹ | -2.69 |
| NGC 3377 | E | 9.9 | 18.80 | 8 x 10⁷ | -2.24 |
| NGC 3379 | E | 9.9 | 19.79 | 1 x 10⁸ | -2.96 |
| NGC 4342 | S0 | 15.3 | 17.04 | 3 x 10⁸ | -1.64 |
| NGC 4486B | E | 15.3 | 16.66 | 6 x 10⁸ | -1.03 |
| M 87 | E | 15.3 | 21.42 | 3 x 10⁹ | -2.32 |
| NGC 4374 | E | 15.3 | 20.96 | 1 x 10⁹ | -2.53 |
| NGC 4261 | E | 29. | 20.89 | 5 x 10⁸ | -2.92 |
| NGC 7052 | E | 59. | 21.31 | 3 x 10⁸ | -3.31 |
| NGC 6251 | E | 106. | 21.81 | 6 x 10⁸ | -3.18 |
| NGC 4945 | Scd/ | 3.7 | 15.1 | 1 x 10⁶ | ... |
| NGC 4258 | Sbc | 7.5 | 17.3 | 4 x 10⁷ | -2.05 |
| NGC 1068 | Sb | 15. | 18.8 | 1 x 10⁷ | ... |
Notes to Table 1: Column 1: galaxy name; column 2: Hubble type; / means that the galaxy is edge-on; column 3: distance based on a Hubble constant of 80 km s-1 Mpc-1; column 4: absolute B-band magnitude of the bulge component of the galaxy; column 5: BH mass based on isotropic models; column 6: ratio of BH mass to bulge mass. The mass in stars is calculated from the luminosity via the mass-to-light ratio measured at large radii. | |||||
However, no complete sample has been studied at high resolution. The detections in Table 1, together with low-resolution studies of larger samples of galaxies, support the hypothesis that BHs live in virtually every galaxy with a substantial bulge component. The total mass in detected remnants is consistent with predictions based on AGN energetics, within the rather large estimated errors in both quantities.
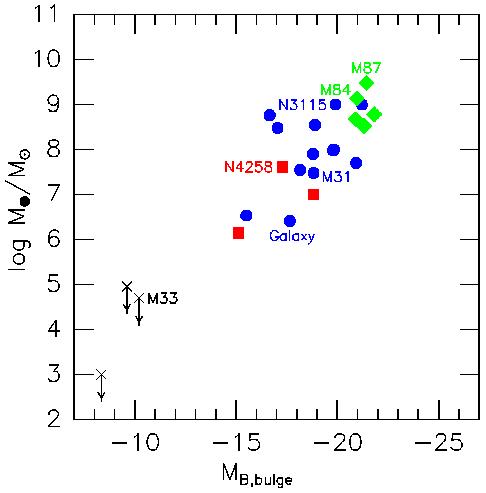
The main new demographic result is an apparent correlation between BH mass and the luminosity of the bulge part of the galaxy. This is shown in Figure 6. Note that the correlation is not with the total luminosity: if the disk is included, the correlation is considerably worse. Whether the correlation is real or not is still being tested. The concern is selection effects. High-mass BHs in small galaxies are easy to see, so their scarcity is real. But low-mass BHs can hide in giant galaxies, so the correlation may be only the upper envelope of a distribution that extends to smaller MBH. If it is real, then the correlation implies that BH formation or feeding is connected with the mass of the high-density, elliptical-galaxy-like part of the galaxy. With the possible exception of NGC 4945 (a late-type galaxy for which the existence and luminosity of a bulge are uncertain), BHs have been found only in the presence of a bulge. However, the limits on MBH in bulgeless galaxies like M 33 are still consistent with the correlation. Current searches concentrate on the question of whether small BHs - ones that are significantly below the apparent correlation - can be found or excluded.
BH mass fractions are listed in Table 1 for cases in which the mass-to-light ratio of the stars has been measured. The median BH mass fraction is 0.29 %. The quartiles are 0.07% and 0.9%.
|
Figure 6. Correlation of BH mass with the absolute magnitude of the bulge component of the host galaxy. Since M/L varies little from bulge to bulge, this implies a correlation between BH mass and bulge mass. Blue filled circles indicate MBH measurements based on stellar dynamics, green diamonds are based on ionized gas dynamics, and red squares are based on maser disk dynamics. It is reassuring that all three techniques are consistent with the same correlation. |