


Inflation produces acoustic oscillations in the early universe which are coherent: all Fourier modes of a given wavelength have the same phase. Such acoustic oscillations have a very specific relationship between velocity and density perturbations, which shows up in the relative angular scales of features in the temperature and polarization power spectra. As emphasized in Hu and Sugiyama (1996), the photon-baryon density perturbation in the tight-coupling regime obeys the differential equation for a forced, damped harmonic oscillator with the damping coming from the expansion of the universe and the forcing from gravitational potential perturbations. The solution is of the form

| (24) |
where the amplitudes vary slowly in time and
rs 
 /
/
 3
is the sound horizon.
The velocity perturbation follows from the photon continuity
equation
3
is the sound horizon.
The velocity perturbation follows from the photon continuity
equation
 0 = - k
 1 / 3, again
neglecting gravitational
potential perturbations. A detailed consideration of boundary
conditions reveals that initial isentropic density perturbations couple
to the cosine harmonic in the small-scale limit, and this approximation
is good even for the largest-wavelength acoustic oscillations
(Hu and White, 1996).
Thus in an inflationary model, at the surface of last scattering,
the photon monopole has a k-dependence of approximately
cos(k
*
/ 3),
while the dipole, which is the main contributor to the polarization,
has a k-dependence of approximately sin(k
*
/ 3).
For initial isocurvature perturbations, the density perturbations
couple instead to the sine harmonic, but the photon monopole
and dipole are still
1 / 3, again
neglecting gravitational
potential perturbations. A detailed consideration of boundary
conditions reveals that initial isentropic density perturbations couple
to the cosine harmonic in the small-scale limit, and this approximation
is good even for the largest-wavelength acoustic oscillations
(Hu and White, 1996).
Thus in an inflationary model, at the surface of last scattering,
the photon monopole has a k-dependence of approximately
cos(k
*
/ 3),
while the dipole, which is the main contributor to the polarization,
has a k-dependence of approximately sin(k
*
/ 3).
For initial isocurvature perturbations, the density perturbations
couple instead to the sine harmonic, but the photon monopole
and dipole are still  / 2 out of phase.
Squaring these amplitudes gives the rough behavior of the
CMB power spectra. Acoustic peaks in the temperature power
spectrum occur at scales where cos2(k
*
/ 3)
has its maxima. The amplitude of the velocity perturbations
are suppressed
by a factor of cs with respect to the density perturbations,
so the temperature peaks reflect only the density perturbations.
The polarization couples to the temperature dipole on scales larger
than the thickness of the last scattering surface, and acoustic
peaks in the polarization power spectrum will be present at scales
where sin2(k
*
/ 3) has its maxima. In other words,
the temperature peaks represent density extrema, the polarization
peaks represent velocity extrema, and for coherent oscillations
these two sets of maxima are at interleaved angular
scales (see Fig. 1).
This is a generic signature of coherent acoustic
oscillations and is likely the most easily measurable
physics signal in microwave background polarization.
If two peaks are detected in the temperature power spectrum,
the angular scale between the two makes a tempting
target for polarization measurements.
|
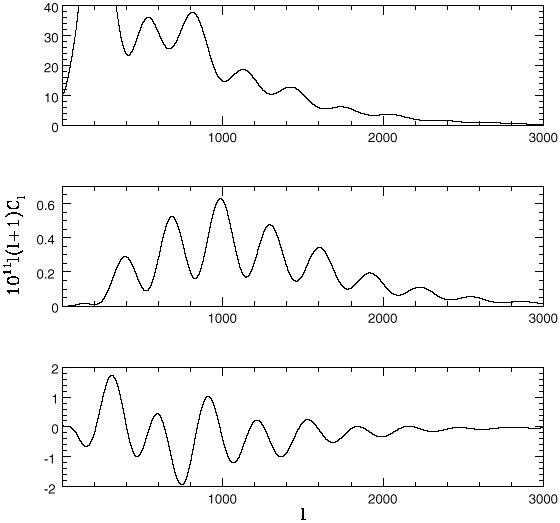
Figure 1. The power spectra for temperature fluctuations (top), polarization (center) and temperature-polarization cross-correlation (bottom) for a typical inflationary model. The oscillations remain in phase up to l = 3000. |
The cross-correlation
between the temperature and polarization will have extrema as
-cos(k
*
/ 3)
sin(k
*
/ 3) which fall
between the temperature and polarization peaks. (The correlation
between the polarization and the velocity contribution to the temperature
averages to zero because of their different angular dependences.)
The sign of the cross-correlation peaks can be used to
deduce whether a temperature peak represents a compression or a
rarefaction, which can be checked against the alternating
peak-height signature
if the universe has a large enough baryon fraction
(Hu and
Sugiyama, 1996).
A combination of isentropic and isocurvature fluctuations shifts all acoustic phases by the same amount if the ratio of their amplitudes is independent of scale, thus leaving the acoustic signature intact. If the amplitude ratio depends on scale, the coherent acoustic oscillations could be modified, but fine tuning would be required to wash them out completely. Multi-field inflation models generically produce both isocurvature and isentropic perturbations (Mukhanov and Steinhardt, 1998; Kofman and Linde, 1987) but the resulting microwave background power spectra are just beginning to be studied in detail (Kanazawa et al., 1998).