


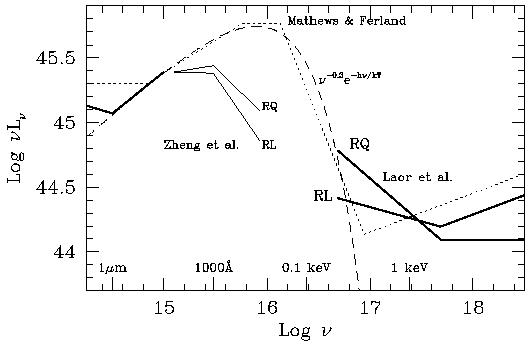
The ionizing continuum shape in AGN is difficult to study directly. At low redshift it is mostly obscured by our own interstellar medium, and inferences must be made from the spectral shape observed in the far-UV and soft X-ray (on either side of the opaque interstellar absorption) as well as from clues provided by the emission lines observed. The notion that continuum radiation of AGN peaked in the unobservable extreme ultraviolet can be traced back to the accretion-disk fits of Malkan & Sargent (1982) as well as the "big blue bump" suggested by the UV and soft X-ray excesses of PG1211+143 (Bechtold et al. 1987). Accounting for the fluxes in the broad emission lines led Mathews & Ferland (1987) to adopt an ionizing spectral shape peaking in the extreme ultraviolet (see Fig. 2).
|
Figure 2. Schematic representations of
inferred spectral energy distributions of AGN after
Laor et al. (1997).
The |
More recent work that uses ensembles of objects to produce a "composite"
spectrum over the observable wavelength range suggests that there is no
extreme ultraviolet peak. The UV composites of
Zheng et al. (1997)
for radio-loud (RL) and radio-quiet
(RQ) objects, shown schematically in Fig. 2,
have a blue far-UV continuum with a distinct break to a steeper spectral index
(f ~
-1.8) at ~ 1000 Å.
Soft X-ray spectral composites constructed by
Laor et al. (1997)
have slopes similar to the short wavelength end of the UV composites.
~
-1.8) at ~ 1000 Å.
Soft X-ray spectral composites constructed by
Laor et al. (1997)
have slopes similar to the short wavelength end of the UV composites.
The Zheng et al. (1997)
composite builds upon the earlier examples of
Baldwin (1977) and
Francis et al. (1991)
to produce an average QSO spectrum
from HST ultraviolet spectra of 100 different QSOs.
This composite consists of all FOS observations of QSOs with z > 0.33
prior to 1996 January 1.
To construct the composite, the observed fluxes were first corrected for
foreground Galactic reddening with a
Seaton (1979)
law using extinction as specified by
Burstein & Heiles (1978).
Strong Lyman  lines and visible
Lyman-limit systems were corrected
in the individual spectra. (Objects with strong intrinsic absorption such as
BALQSOs were simply omitted from the composite.)
Fainter Ly forest lines and the
"Lyman valley"
(Møller &
Jakobsen 1990)
were corrected for statistically
as a function of redshift. The result from
Zheng et al. (1997)
is shown in Fig. 3.
lines and visible
Lyman-limit systems were corrected
in the individual spectra. (Objects with strong intrinsic absorption such as
BALQSOs were simply omitted from the composite.)
Fainter Ly forest lines and the
"Lyman valley"
(Møller &
Jakobsen 1990)
were corrected for statistically
as a function of redshift. The result from
Zheng et al. (1997)
is shown in Fig. 3.

|
Figure 3. The composite QSO spectrum of
Zheng et al. (1997)
shows a break in spectral
index at 1000 Å where it flattens to
f |
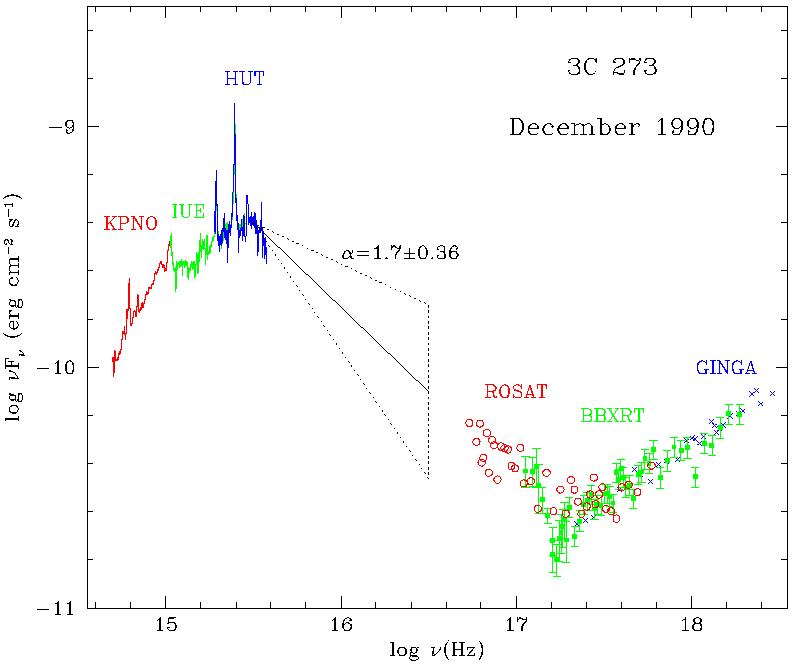
Work currently in progress by Telfer et al. (2000) is updating this composite spectrum using the same technique with a sample that is nearly three times larger. Containing spectra of 248 QSOs obtained prior to 2000 May 31, the Telfer et al. (2000) composite is nearly identical to the Zheng et al. (1997) result. A physical interpretation of the spectral shape observed by Zheng et al. (1997) is that the typical AGN spectrum is Comptonized radiation from an accretion disk. A spectral break near the Lyman limit is a characteristic expected in Comptonized accretion-disk spectra. Comptonization smears out the Lyman-limit edge of the intrinsic accretion-disk spectrum and produces a power-law tail at wavelengths shortward of ~ 1000 Å. Although a simple model of a Comptonized disk provides a good fit to the Zheng et al. composite, there is the nagging question of how physical such a composite is, and whether its shape holds any physical meaning since the individual spectra of the sample QSOs vary in shape over quite a wide range. The study of the 3C 273 far-UV spectrum by Kriss et al. (1999) provides a firm physical basis for the interpretation of the Zheng et al. composite. In the 3C 273 spectrum (also shown in Fig. 3), one sees the same qualitative characteristics as in the composite spectrum - the spectral index steepens at ~ 1000 Å in the rest frame. As shown further in Fig. 4, the shorter-wavelength UV spectrum extrapolates very well to the observed soft-X-ray spectrum. Both the composite spectra and the spectrum of 3C 273 leave little room in the extreme ultraviolet for a big bump in the QSO spectral energy distribution.
|
Figure 4. The far-UV and soft X-ray spectra of 3C 273 allow little room for a bump in the extreme ultraviolet. |
The apparent lack of an extreme ultraviolet peak in the ionizing
spectrum now leaves us in a quandary. The analysis of
Mathews & Ferland (1987)
based on the broad emission line fluxes is still valid;
Korista, Ferland, &
Baldwin (1997)
suggest that the BLR "sees" a different continuum shape
than we do since the He II
 1640 equivalent widths in
moderate redshift QSOs require more ionizing photons than are present in the
Zheng et al. composite.
On the other hand, the mean spectral index of the QSO composite matches the
ionization requirements for H I and He II absorption by the IGM
(Zhang et al. 1997),
so apparently the IGM is seeing the same average that
we are.
It may be that the answer lies in detailed studies of individual objects.
Objects with high He II equivalent widths may dominate the He II
average, but these same objects may not be represented in the sample of spectra
contributing to the composite at short wavelengths.
Far-UV and soft X-ray spectra of objects at moderate redshift that tightly
constrain the possible EUV spectral shape (as shown above for 3C 273) may resolve this issue.
1640 equivalent widths in
moderate redshift QSOs require more ionizing photons than are present in the
Zheng et al. composite.
On the other hand, the mean spectral index of the QSO composite matches the
ionization requirements for H I and He II absorption by the IGM
(Zhang et al. 1997),
so apparently the IGM is seeing the same average that
we are.
It may be that the answer lies in detailed studies of individual objects.
Objects with high He II equivalent widths may dominate the He II
average, but these same objects may not be represented in the sample of spectra
contributing to the composite at short wavelengths.
Far-UV and soft X-ray spectra of objects at moderate redshift that tightly
constrain the possible EUV spectral shape (as shown above for 3C 273) may resolve this issue.