


The recent completion of an optical spectroscopic survey of the nuclei of
a large sample of nearby galaxies
(Ho, Filippenko, &
Sargent 1995)
provides
an excellent data base with which to reexamine the issues discussed above.
High signal-to-noise ratio, moderate-resolution (2.5-4 Å), long-slit
spectra were obtained for a magnitude-limited (BT
 12.5 mag) sample
of 486 northern (
12.5 mag) sample
of 486 northern ( > 0°)
galaxies using the Hale 5-m reflector at Palomar Observatory
(Filippenko & Sargent
1985).
Nearly all of the
observations were obtained with a 2" slit, and spectra were derived from
an effective aperture of 2" x 4", corresponding to physical
dimensions of ~ 170 pc x 340 pc for the median distance of 17 Mpc.
> 0°)
galaxies using the Hale 5-m reflector at Palomar Observatory
(Filippenko & Sargent
1985).
Nearly all of the
observations were obtained with a 2" slit, and spectra were derived from
an effective aperture of 2" x 4", corresponding to physical
dimensions of ~ 170 pc x 340 pc for the median distance of 17 Mpc.
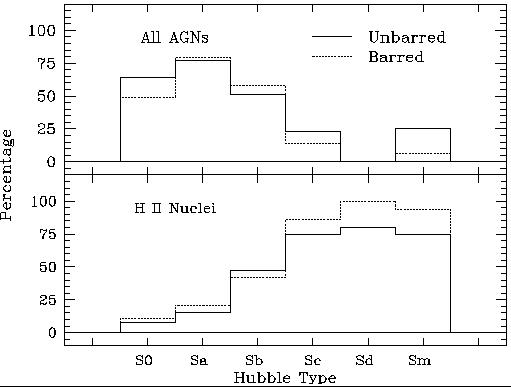
Approximately 60% of S0-Sm spirals in our sample contain bars (Fig. 1), in agreement with the statistics of Sellwood & Wilkinson (1993) for field spirals. Adopting the spectral classifications given in Ho, Filippenko, & Sargent (1996b), we examine the dependence of the detection rate of H II nuclei (those photoionized by OB stars) and AGNs [including LINERs (low-ionization nuclear emission-line regions), LINER/H II nuclei transition objects, and Seyfert 1 and 2 nuclei] on the presence of a bar for 428 spiral galaxies. While the distribution of unbarred galaxies does not differ appreciably from that of barred galaxies among AGNs, there is clearly a difference among H II nuclei (Fig. 2). Applying the Kolmogorov-Smirnov test, we find that the probability (PKS) that the two distributions are drawn from the same population is only 50.1% for the AGNs, whereas PKS = 0.2% for the H II nuclei. The latter result is highly statistically significant, implying that nuclear star formation occurs more frequently in barred spirals.

|
Figure 1. Distribution of Hubble types for the 486 galaxies in the survey. Unbarred galaxies are shown in the hatched histogram, and barred galaxies in the unhatched histogram. |
|
Figure 2. Distribution of AGNs (top) and H II nuclei (bottom) as a function of Hubble type. Barred and unbarred galaxies are shown separately. |
The effect of bars on the strength of the activity can be gauged
by inspecting the distributions of the luminosity of a strong emission
line such as H . In
Figure 3, ``early-type''
spirals (S0-Sbc) are
shown separately from ``late-type'' spirals (Sc-Sm). It is apparent that
among H II nuclei, barred early-type systems show significantly higher
H luminosities than unbarred
counterparts (PKS = 3.3%), whereas no
such trend is present for the late-type systems. The line strengths of
AGNs, by contrast, appear not to be influenced by the presence of a bar,
regardless of the morphological type. We find the same trend when we
use the equivalent width of H
emission as the indicator instead of the
line luminosity
(Ho et al. 1996c).
. In
Figure 3, ``early-type''
spirals (S0-Sbc) are
shown separately from ``late-type'' spirals (Sc-Sm). It is apparent that
among H II nuclei, barred early-type systems show significantly higher
H luminosities than unbarred
counterparts (PKS = 3.3%), whereas no
such trend is present for the late-type systems. The line strengths of
AGNs, by contrast, appear not to be influenced by the presence of a bar,
regardless of the morphological type. We find the same trend when we
use the equivalent width of H
emission as the indicator instead of the
line luminosity
(Ho et al. 1996c).

|
Figure 3. Distributions of
H |