

2.7. The Spectral Energy Distributions of LINERs
Luminous AGNs generally display a fairly ``universal'' spectral energy
distribution (SED) (e.g.,
Elvis et al. 1994).
The SED from the infrared to the
X-rays, roughly flat in log  F
F - log
- log
 space, can be represented
by an underlying power law (
 1, where
F

 -
- )
superposed with several distinct
components, the most prominent of which is a broad UV excess. This so-called
big blue bump is conventionally interpreted as thermal emission from an
optically thick, physically thin accretion disk
(Malkan and Sargent 1982).
As multiwavelength data for LINERs and other low-luminosity AGNs become
more readily available, we can begin to piece together their SEDs. Comparing
SEDs of AGNs of various luminosities might yield clues to physical processes
that depend on luminosity.
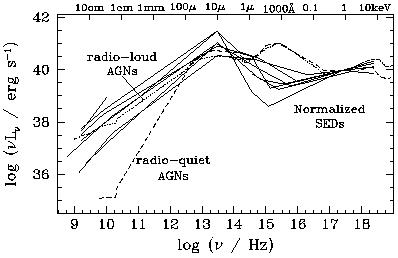
The SEDs of the low-luminosity AGNs share a number of common traits, and yet
they differ markedly from the SEDs of luminous AGNs
(Ho 1998b). To
illustrate this point, Figure 5 normalizes the
SEDs of seven low-luminosity
objects (mostly LINERs) with the median SED of radio-loud and radio-quiet AGNs
from Elvis et al. (1994).
Several features are noteworthy. (1) The
optical-UV slope is quite steep. The power-law indices for the seven
low-luminosity objects average
<  >
>
 1.8, whereas in luminous
AGNs
 0.5-1. (2) The UV band is
exceptionally dim relative
to the optical and X-ray bands; there is no evidence for a big blue bump
component. Indeed, the SED reaches a local minimum somewhere in the far-UV or
extreme-UV region. The mean value of
  ox, the two-point
spectral index between 2500 Å and 2 keV, is ~ 0.9, to be compared with
<
  ox > = 1.2-1.4 for
luminous Seyferts and QSOs. (3) There is
tentative evidence for a maximum in the SED at mid-IR wavelengths.
(4) The nuclei have radio spectra that are either flat or inverted.
(5) All sources, including the three spiral galaxies in the sample, qualify as
being radio-loud. This finding runs counter to the usual notion that
only elliptical galaxies host radio-loud AGNs. (6) The bolometric
luminosities of the sources range from Lbol = 2 x
1041 to 8 x 1042
ergs s-1, or ~ 10-6-10-3 times the
Eddington rate for the black hole masses estimated for these objects.

|
Figure 5. Interpolated SEDs of seven low-luminosity AGNs (solid lines) normalized to the 1 keV luminosity of M81. The median SEDs of radio-loud (dotted line) and radio-quiet (dashed line) AGNs of Elvis et al. (1994), normalized in the same way, have been overplotted for comparison. From Ho (1998b). |
The overall characteristics of these nonstandard SEDs can be explained
by models of ``advection-dominated accretion flows'' (ADAFs;
see Narayan et al. 1998
for a review). The accretion flow equations admit
a stable advection-dominated, optically thin solution when the accretion
rate falls to very low values (
 10-2
10-2
 Edd).
Under these conditions, the low density
and low optical depth of the accreting material lead to inefficient
cooling, and the resulting radiative efficiency is much less than the
canonical value of 10%. This accounts for the low observed luminosities.
Moreover, the predicted SEDs of ADAFs look radically different from the
SEDs of optically thick disks but provide a good match for the observations
of low-luminosity AGNs
(Ho and Narayan 1998).