


6.1. Emission-Line Luminosity
In lieu of direct measurement of the nonstellar featureless continuum at
optical wavelengths, an almost impossible feat for the low-luminosity sources
in question, one might use, as a substitute, an indirect measure such as the
luminosity of a narrow emission line powered by the continuum. In luminous
AGNs, whose nonstellar optical continuum generally overwhelms the stellar
background, the H luminosity
scales linearly with the luminosity of the continuum
(Searle & Sargent 1968;
Yee 1980;
Shuder 1981).
However, using line luminosities derived
from slit spectroscopy is not without complications, especially for the
relatively narrow slit employed in the Palomar survey. For any given object,
the amount of line emission sampled will depend on its distance as well as on
the physical extent of the line-emitting region. Moreover, circumnuclear H II
regions undoubtedly contaminate the line emission at some level (indeed, for
transition objects, this is assumed a priori). These limitations
notwithstanding, it can be argued that a statistical examination
of such
line luminosities might still be of value, as the individual ``fluctuations''
will tend to average out for sufficiently large samples. The
H
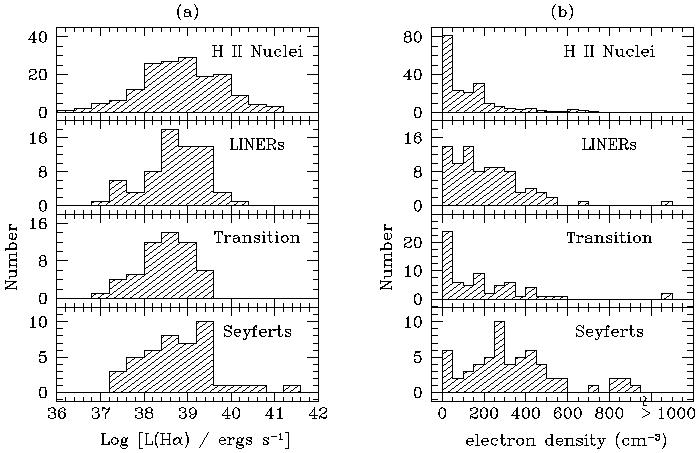
luminosities for the various classes of emission-line nuclei are shown in
Figure 5a. The incredible feebleness of
the low-luminosity AGNs can be readily
appreciated by realizing that a sizable fraction of H II nuclei and disk giant
H II regions (e.g.,
Kennicutt 1988),
not to mention starburst nuclei (e.g.,
Balzano 1983),
in fact have much stronger
H luminosities than these
sources. Remarkably, the distributions for LINERs and Seyferts appear very
similar, both having a median
L(H)
luminosity
scales linearly with the luminosity of the continuum
(Searle & Sargent 1968;
Yee 1980;
Shuder 1981).
However, using line luminosities derived
from slit spectroscopy is not without complications, especially for the
relatively narrow slit employed in the Palomar survey. For any given object,
the amount of line emission sampled will depend on its distance as well as on
the physical extent of the line-emitting region. Moreover, circumnuclear H II
regions undoubtedly contaminate the line emission at some level (indeed, for
transition objects, this is assumed a priori). These limitations
notwithstanding, it can be argued that a statistical examination
of such
line luminosities might still be of value, as the individual ``fluctuations''
will tend to average out for sufficiently large samples. The
H
luminosities for the various classes of emission-line nuclei are shown in
Figure 5a. The incredible feebleness of
the low-luminosity AGNs can be readily
appreciated by realizing that a sizable fraction of H II nuclei and disk giant
H II regions (e.g.,
Kennicutt 1988),
not to mention starburst nuclei (e.g.,
Balzano 1983),
in fact have much stronger
H luminosities than these
sources. Remarkably, the distributions for LINERs and Seyferts appear very
similar, both having a median
L(H)
 6 x 1038 ergs
s-1; transition
objects tend to be somewhat less luminous, but the difference is insignificant
according to the Kolmogorov-Smirnov (K-S) test. (The probability that the
LINERs and transition objects are drawn from the same population,
PKS,
is 0.16.) The above comparison is not obviously affected by known systematic
biases, since all three subclasses have virtually identical distance
distributions, modest reddening corrections were consistently applied, and
it was already shown (Section 5) that the host
galaxies of LINERs and Seyferts are grossly similar.
6 x 1038 ergs
s-1; transition
objects tend to be somewhat less luminous, but the difference is insignificant
according to the Kolmogorov-Smirnov (K-S) test. (The probability that the
LINERs and transition objects are drawn from the same population,
PKS,
is 0.16.) The above comparison is not obviously affected by known systematic
biases, since all three subclasses have virtually identical distance
distributions, modest reddening corrections were consistently applied, and
it was already shown (Section 5) that the host
galaxies of LINERs and Seyferts are grossly similar.
|
Figure 5. (a) Distribution of
dereddened luminosities for the narrow
H |
Heckman (1980b) claimed that the line luminosities of LINERs are smaller than those of Seyferts, contrary to what we and Stauffer (1982b) find. The principal reason for this difference appears to be that Heckman used for comparison a sample of Seyferts, taken from Adams & Weedman (1975), which was biased toward luminous sources.
One should be cautious in interpreting these results. Superficially, it appears that both LINERs and Seyferts have the same ``level'' of activity, if one assumes that the narrow-line luminosity is an appropriate yard stick for gauging the power output of the central source. It remains to be demonstrated, however, that the line-continuum relation of luminous AGNs continues to hold for low-luminosity sources. There is preliminary evidence, for instance, that the spectral energy distributions of LINERs and low-luminosity Seyferts may differ appreciably from those of high-luminosity sources (Ho, Filippenko, & Sargent 1996b). If so, the equivalent widths of emission lines, and hence the slope of the line-continuum relation, will vary systematically with luminosity.
