


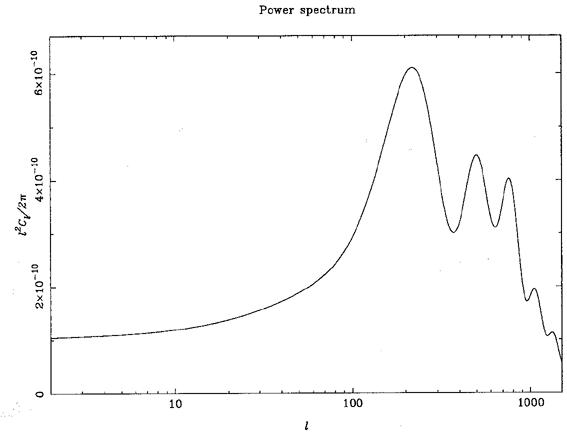
Primordial fluctuations of the CMB contain a great deal of information about physical processes occurring in the early universe. Since some of these processes depend upon the value of H0, then obviously there is a hope that by getting accurate enough information about the CMB, we may be able to pin down H0 quite independently of either optical determinations, or the physical methods like SZ and gravitational lensing. Figure 7 shows the power spectrum for primordial fluctuations of the CMB predicted from inflationary theory and the cold dark matter (CDM) model. The quantities plotted are l(l + 1)cl, versus l where cl is defined via
|
and the Ylm are standard spherical
harmonics. Increasing l corresponds to decreasing
angular scale  , with a rough
relationship between the two of
, with a rough
relationship between the two of
 2/l radians. We see
that on large angular scales
(
2/l radians. We see
that on large angular scales
( 2°) we expect the
CMB power spectrum to reflect the initially near scale-invariant
spectrum coming out of inflation; on intermediate angular
scales we expect to see a series of peaks, and on smaller angular scales
(
2°) we expect the
CMB power spectrum to reflect the initially near scale-invariant
spectrum coming out of inflation; on intermediate angular
scales we expect to see a series of peaks, and on smaller angular scales
( 10 arcmin) we
expect to see a sharp decline in amplitude. In terms of the diameter of
corresponding
proto-objects imprinted in the CMB, then a rich cluster of galaxies
corresponds to a scale
of about 8 arcmin, while the angular scale corresponding to the largest
scale of clustering
we know about in the universe today corresponds to 1/2 to 1 degree. The
first large peak
in the power spectrum, at l's near 200, and therefore angular
scales near 1°, is known as
the `Doppler,' or `Sakharov,' or `acoustic' peak.
10 arcmin) we
expect to see a sharp decline in amplitude. In terms of the diameter of
corresponding
proto-objects imprinted in the CMB, then a rich cluster of galaxies
corresponds to a scale
of about 8 arcmin, while the angular scale corresponding to the largest
scale of clustering
we know about in the universe today corresponds to 1/2 to 1 degree. The
first large peak
in the power spectrum, at l's near 200, and therefore angular
scales near 1°, is known as
the `Doppler,' or `Sakharov,' or `acoustic' peak.
|
Figure 7. Power spectrum for standard
CDM. Parameters assumed are
|
Now we come to a very interesting point. The position of this Doppler
peak, and of
the smaller secondary peaks, is determined by the value of the total
 ,
and varies as lpeak
,
and varies as lpeak
 -1/2 (This behavior
is determined by the linear size of the causal horizon at
recombination, and the usual formula for angular diameter
distance). This means that
if we were able to determine the position (in a left/right sense) of
this peak, and we were
confident in the underlying model assumptions, then we could read off
the value of the
total density of the universe (In the case where the cosmological
constant was non-zero
we would effectively be reading off the combination
matter +
-1/2 (This behavior
is determined by the linear size of the causal horizon at
recombination, and the usual formula for angular diameter
distance). This means that
if we were able to determine the position (in a left/right sense) of
this peak, and we were
confident in the underlying model assumptions, then we could read off
the value of the
total density of the universe (In the case where the cosmological
constant was non-zero
we would effectively be reading off the combination
matter +
 ). This would be a
determination of free of all
the usual problems encountered in local determinations
using velocity fields etc. Similar remarks apply to the Hubble
constant. The height of
the Doppler peak is controlled by a combination of H0
and the density of the universe
in baryons, b. We
have a constraint on the combination
b
H20 from nucleosynthesis,
and thus using this constraint and the peak height we can determine
H0 within a band
compatible with both nucleosynthesis and the CMB. Alternatively, if we
have the power
spectrum available to good accuracy covering the secondary peaks as
well, then it is possible to read off the values of
tot,
b and
H0 independently, without having to bring
in the nucleosynthesis information. The overall point here, is that the
power spectrum
of the CMB contains a wealth of physical information, and that once we
have it to good
accuracy, and have become confident that an underlying model, such as
inflation and
CDM, is correct then we can use the spectrum to obtain the values of
parameters in the model, potentially to high accuracy.
). This would be a
determination of free of all
the usual problems encountered in local determinations
using velocity fields etc. Similar remarks apply to the Hubble
constant. The height of
the Doppler peak is controlled by a combination of H0
and the density of the universe
in baryons, b. We
have a constraint on the combination
b
H20 from nucleosynthesis,
and thus using this constraint and the peak height we can determine
H0 within a band
compatible with both nucleosynthesis and the CMB. Alternatively, if we
have the power
spectrum available to good accuracy covering the secondary peaks as
well, then it is possible to read off the values of
tot,
b and
H0 independently, without having to bring
in the nucleosynthesis information. The overall point here, is that the
power spectrum
of the CMB contains a wealth of physical information, and that once we
have it to good
accuracy, and have become confident that an underlying model, such as
inflation and
CDM, is correct then we can use the spectrum to obtain the values of
parameters in the model, potentially to high accuracy.
Experimentally, the CMB data is approaching the point where meaningful
comparison
between theory and prediction, as regards the shape and normalization of
the power
spectrum, can be made. This is particularly the case with the new
availability of the recent CAT
(Scott et al. (1996))
and Saskatoon (Netterfield et al., submitted) results,
where the combination of scales they provide is exactly right to begin
tracing out the
shape of the first Doppler peak (If this exists, and if
tot = 1). Before
embarking on this
exercise, some proper cautions ought to be given. First, the current CMB
data is not
only noisy, with in some cases uncertain calibration, but will still
have present within it
residual contamination, either from the Galaxy, or from discrete radio
sources, or both.
Experimenters make their best efforts to remove these effects, or to
choose observing
strategies that minimize them, but the process of getting really `clean'
CMB results, free
of these effects to some guaranteed level of accuracy, is still only in
its infancy. Secondly,
in any comparison of theory and data where parameters are to be
estimated, the results
for the parameters are only as good as the underlying theoretical models
and assumptions
that went into them. If CDM + inflation turns out not to be a viable
theory for example, then the bounds on H0 and
derived below will have to be
recomputed for whatever
theory replaces it. Many of the ingredients which go into the form of
the power spectrum
are not totally theory-specific (this includes the physics of
recombination, which involves
only well-understood atomic physics), so that one can hope that at least
some of the results found will not change too radically.
This said, it is certainly of interest to begin this process of
quantitative comparison of CMB data with theoretical curves.
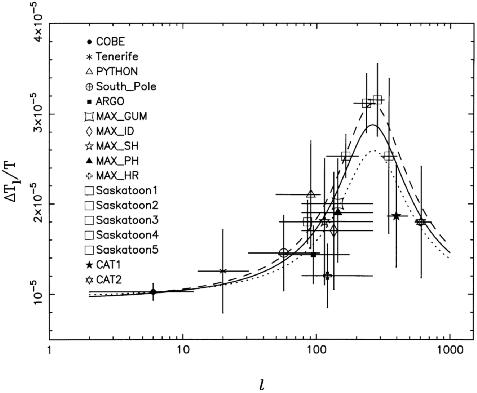
Fig. 8 shows a set of recent data points, some
of them discussed above, put on a common scale (which may effectively be
treated as
sqrt[l(l + 1)cl)], and compared with an
analytical representation of the first Doppler peak
in a CDM model. The work required to convert the data to this common framework
is substantial, and is discussed in Hancock et al., submitted, from
where this figure was
taken. The analytical version of the power spectrum is parameterized by
its location
in height and left/right position, and enables one to construct a
likelihood surface for
the parameters and
Apeak, where Apeak is the height of
the peak, and is related to a
combination of b and
H0, as discussed above. The dotted and dashed extreme
curves in
Fig. 8 correspond to the fact that the
calibration of the Saskatoon experiment is not well
established (Netterfield et al., submitted), and indicate the best fits
obtained by varying
the amplitude of the Saskatoon points by ± 14%. The central fit
yields a 68% confidence interval of
| (6.2) |
with a maximum likelihood point of
= 0.7 after marginalization
over the value of
Apeak. Incorporating nucleosynthesis information as
well, as sketched above (specifically we assume the
Copi et al. (1995)
bounds of 0.009  bh2
0.02), we obtain a 68%
confidence interval for H0 of
bh2
0.02), we obtain a 68%
confidence interval for H0 of

| (6.3) |
This range ignores the Saskatoon calibration uncertainty. Generally, in the range of parameters of current interest, increasing H0 lowers the height of the peak. Thus taking the Saskatoon calibration to be lower than nominal, for example by the 14% figure quoted as the one-sigma error, enables us to raise the allowed range for H0. By this means, an upper limit closer to 70 km s-1 Mpc-1 is obtained.
|
Figure 8. Analytic fit to power spectrum versus experimental points (Taken from Hancock et al., submitted). |
These first results are only schematic, but considering this is a totally new method, give a very encouraging agreement with the range of H0 picked out by other methods, though with a slightly lower mean that most optical determinations, in agreement with the Ryle SZ results so far.
What of the future? Although the Cosmic Anisotropy Telescope (CAT) in Cambridge
has already provided maps of CMB anisotropy on scales ~ 0°.4, these
are relatively poor
as images due to the limited number of baseline lengths and pixels
available. In fact,
the CAT is a prototype for a considerably more advanced instrument, the
Very Small
Array (VSA). The objectives of the VSA are to obtain detailed maps of
the CMB with a
sensitivity approaching 5µK and covering a range of angular scales
from 10' to 2°. The
good accuracy available over a scale range that is well-matched to the
positions of the
first and secondary Doppler peaks in the power spectrum, should enable
measurements
of and H0 to
be made to an accuracy of better than 10%. The instrument is currently
under construction at Cambridge and Jodrell Bank, and it is hoped it
will be operational in Tenerife by the middle of the year 1999.
Two new satellite experiments to study the CMB have recently been selected as future missions. These are MAP, or Microwave Anisotropy Probe, which has been selected by NASA as a Midex mission, for launch probably in 2001, and COBRAS/SAMBA, which has been selected by ESA as an M3 mission, and will be launched hopefully soon after 2004.
A crucial feature of a satellite experiment is the potential all-sky
coverage that it
affords, and the ability to map features on large angular scales
( 10°). Neither of these
facilities are possible from the ground, due to problems with the
atmosphere. On the
other hand a satellite experiment has more problems in attaining
resolution at the smaller
angular scales, because of the limited dish size possible within the
confines of the launcher.
In this respect high frequency capability is an advantage. The best
angular resolution
offered by MAP is 18 arcmin, in its highest frequency channel at 90 GHz,
and the median
resolution of its channels is more like 30 arcmin. This means that it
may have difficulty
in pinning down the full shape of the first and certainly secondary
Doppler peaks in
the power spectrum. On the other hand, the angular resolution of COBRAS/SAMBA
extends down to 4 arcmin, with a median (across the six channels most
useful for CMB
work) of about 10 arcmin. This means that it will be able to determine
the power
spectrum to good accuracy, all the way into the secondary peaks, and
that consequently
very good accuracy in determining cosmological parameters will be
possible. In fact
if COBRAS/SAMBA can measure one third of the CMB sky to an accuracy (after
foreground subtraction) of 2 x 10⁻⁶ in
 T/T per pixel, then a
joint determination of
and H0 to ~ 1% accuracy is possible in
principle. There seems little chance of being able
to do this by any other means, and in conjunction with the other
powerful capabilities of
the satellite, balloon and ground-based experiments to come, represents
a tremendously exciting prospect for the future.
T/T per pixel, then a
joint determination of
and H0 to ~ 1% accuracy is possible in
principle. There seems little chance of being able
to do this by any other means, and in conjunction with the other
powerful capabilities of
the satellite, balloon and ground-based experiments to come, represents
a tremendously exciting prospect for the future.
We thank all the other colleagues at Cambridge and Jodrell Bank involved in the Ryle, CAT and VSA work and in particular thank Keith Grainge for permission to use material from his thesis. We also thank Stephen Hancock, Graca Rocha and Carlos Gutierrez for permission to quote from joint results before publication.