


12.1. Tests of the evolving IR population in the HDFs and CFRS fields
The ISO observatory has deeply surveyed with CAM LW3 some of the best investigated sky areas, in particular the two Hubble Deep Fields (North & South, Rowan-Robinson et al. 1997, Oliver et al. 2000b) and the area CFRS 1415+52 (Flores et al. 1999). Given the variety of multi-wavelength data and the almost complete spectroscopic follow-up, the surveys in these areas have allowed to achieve important tests of the evolving population responsible for the upturn of the ISO mid-IR counts and for a substantial fraction of the CIRB.
Aussel et al. (1999
and 2000)
report reliably tested (see Sect. 9.3)
complete samples of 49 and 63 sources to
S15 ![]() 100µJy in the HDF North and South
respectively, covering similar areas of 25 sq. arcmin each.
Flores et al. (1999)
analyse a sample of 41 sources brighter than
S15
100µJy in the HDF North and South
respectively, covering similar areas of 25 sq. arcmin each.
Flores et al. (1999)
analyse a sample of 41 sources brighter than
S15 ![]() 300µJy (S/N > 4)
over an area of 10' × 10' in CFRS 1415+52.
The vast majority (90%) of the ISO sources in the HDF surveys have
spectroscopic
redshifts, and for the remaining objects photometric redshifts are
easily estimated.
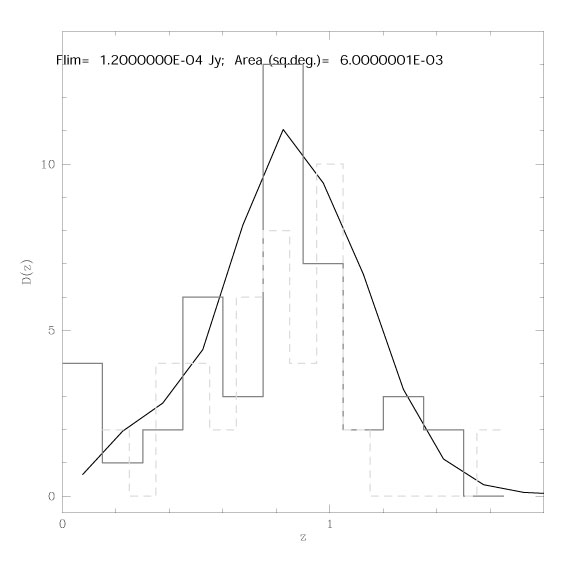
The redshift distributions d (z)
for the HDF and CFR1415 surveys are reported in
Figure 10, and compared with the model
fitting the multi-wavelength counts mentioned in
Sect. 11.2.
Although the two surveys cover individually small sky areas, the fair
match between
them gives some confidence about the overall reliability of the result.
These data set a stringent limit on the rate of cosmological evolution for
IR galaxies above z
300µJy (S/N > 4)
over an area of 10' × 10' in CFRS 1415+52.
The vast majority (90%) of the ISO sources in the HDF surveys have
spectroscopic
redshifts, and for the remaining objects photometric redshifts are
easily estimated.
The redshift distributions d (z)
for the HDF and CFR1415 surveys are reported in
Figure 10, and compared with the model
fitting the multi-wavelength counts mentioned in
Sect. 11.2.
Although the two surveys cover individually small sky areas, the fair
match between
them gives some confidence about the overall reliability of the result.
These data set a stringent limit on the rate of cosmological evolution for
IR galaxies above z ![]() 1, which needs to level off to avoid exceeding
the observed d (z) on the high-z tail. Note however
that the observed high-z convergence of d (z)
is also partly an effect of the strong K-correction in the LW3 flux for
dust-rich galaxies
(see an example in Fig. 9):
disentangling K- from evolutionary-corrections
at z > 1 will require SIRTF and FIRST.
1, which needs to level off to avoid exceeding
the observed d (z) on the high-z tail. Note however
that the observed high-z convergence of d (z)
is also partly an effect of the strong K-correction in the LW3 flux for
dust-rich galaxies
(see an example in Fig. 9):
disentangling K- from evolutionary-corrections
at z > 1 will require SIRTF and FIRST.
|
Figure 10. Redshift distributions from the HDFN (Aussel et al. 2000) and CFRS 1415+52 ISOCAM LW3 samples, compared with model predictions. |
HST imaging data on these fields provide detailed morphological information on ISO sources. Elbaz et al. (1999) and Aussel et al. (1999) find that 30 to 50% of them show clear evidence of peculiarities and multiple structures, in keeping with the local evidence that galaxy interactions are the primary trigger of luminous IR starbursts. From their Caltech redshift survey in the HDF North, Cohen et al. (1999) report that over 90% of the faint LW3 ISO sources are members of galaxy concentrations and groups, which they identify as peaks in their redshift distributions. Indeed, it is in these dense galaxy environments with low velocity dispersion that interactions produce resonant perturbation effects on galaxy dynamics.
12.1.1. Optical and NIR spectral properties: nature of the IR sources
Flores et al. (1999)
report a preliminary analysis of the spectra of IR sources
in CFRS 1415+52, noting that a majority fraction of these display both
weak emission (OII 3787) and absorption (H![]() ) lines, as typical of the
e(a) galaxy spectral
class: the latter is mentioned in the literature as a post-starbursting
population,
one in which a vast population of A-type absorption-line stars from a
) lines, as typical of the
e(a) galaxy spectral
class: the latter is mentioned in the literature as a post-starbursting
population,
one in which a vast population of A-type absorption-line stars from a ![]() 1 Gyr old
massive starburst combine with a small residual of ongoing SF
evidenciated by the weak OII emission.
Given the far-IR selection of the faint ISO sources, which is expected
to preferentially
detect dusty star-forming galaxies, this result would be difficult to
understand,
as it lets open the question of "why the ongoing active starbursts are
not detected".
1 Gyr old
massive starburst combine with a small residual of ongoing SF
evidenciated by the weak OII emission.
Given the far-IR selection of the faint ISO sources, which is expected
to preferentially
detect dusty star-forming galaxies, this result would be difficult to
understand,
as it lets open the question of "why the ongoing active starbursts are
not detected".

|
Figure 11. ISAAC/VLT spectrum of HDFS
source # 53 at z = 0.58. The H |
Rigopoulou et
al. (2000) and
Franceschini et al. (2000b)
have observed with ISAAC on VLT
a sample of 13 high-z (0.2 < z < 1.4) galaxies selected in
the HDF South to S15 > 100 µJy:
the H![]() line is detected in virtually all of the sources, and
found quite
prominent (EW > 50 Å), indicating substantial rates of SF
after de-reddening corrections, and demonstrating that these optically
faint but IR luminous
sources are indeed powered by an ongoing massive dusty starburst.
line is detected in virtually all of the sources, and
found quite
prominent (EW > 50 Å), indicating substantial rates of SF
after de-reddening corrections, and demonstrating that these optically
faint but IR luminous
sources are indeed powered by an ongoing massive dusty starburst.
The e(a) spectral appearence is interpreted by Poggianti & Wu (2000) and Poggianti, Bressan, Franceschini (2000) as due to selective dust attenuation, extinguishing more the newly-formed stars than the older ones which have already disrupted their parent molecular cloud.
These papers independently found that
![]() 70 - 80% of the energy emitted by young
stars and re-processed in the far-IR leaves no traces in the optical
spectrum, hence
can only be accounted for with long-wavelength observations.
70 - 80% of the energy emitted by young
stars and re-processed in the far-IR leaves no traces in the optical
spectrum, hence
can only be accounted for with long-wavelength observations.
12.1.2. Evaluating baryonic masses and the SFR of the IR population
Further efforts of optical-NIR spectroscopic follow-up of faint
IR sources are planned for the next years, including attempts to address
the
source kinematics and dynamics based on line studies with the
next-generation of
IR spectrographs (e.g. SINFONI on VLT). The latter would be particularly
relevant in
consideration of the typically complex dynamical structure of luminous
IR starbursts.
At the moment, for an evaluation of the main properties of the IR population
we have to rely on indirect estimates exploiting the near-IR and far-IR
fluxes.
One important parameter is the baryonic mass in stars, for measure of which
fits of local template SEDs to the near-IR broad-band spectrum can be used.
Our estimated values of the baryonic mass (![]() 1011 M
1011 M![]() , with 1 dex typical
spread, see Figure 12) indicate that already
evolved and massive galaxies host the powerful starbursts.
, with 1 dex typical
spread, see Figure 12) indicate that already
evolved and massive galaxies host the powerful starbursts.

|
Figure 12. Star formation rates and baryonic masses as a function of redshift for galaxies selected by ISOCAM LW3 at 15µm in the HDFN and CFRS 1415+52. |
As a measure of the rate of star-formation (SFR), the other fundamental
parameter describing the physical and
evolutionary status of the sources, we have exploited the mid-IR flux as
an alternative to
the (heavily extinguished) optical emissions, since it is much more
directly
related to the bolometric (mostly far-IR) flux, which is the most robust
indicator of the number of massive reddened newly-formed stars.
Vigroux et al. (1998)
find that the
ISOCAM mid-IR fluxes (from both LW3 and LW2 ISOCAM observations)
are tightly and linearly related with the bolometric
emission in local galaxies, evidence contradicted only in very
extinguished peculiar
sources (e.g. Arp 220), for which the mid-IR spectrum is self-absorbed.
Using several HDF North sources having both the mid-IR and radio flux,
Aussel et al. (2000)
find that the two SFR estimators, both largely unaffected by
dust extinction, provide consistent results on the SFR.
However, the mid-IR flux has the advantage over the radio to be less
affected by AGN emission, providing a more reliable SF measurer
(Cohen et al. 1999;
Aussel et al. 2000;
Franceschini et al. 2000b).
Also the fact that only 7 of the 49 IR SBs in the HDFN
are detected in radio to a flux limit of few tens of
µJy tells that the mid-IR flux
is a more sensitive indicator of SF.
This untill dedicated space missions (in particular the 3.6m FIRST
observatory) will measure the peak of dust emission at
![]()
![]() 100 µm in high-redshift
galaxies with high accuracy.
100 µm in high-redshift
galaxies with high accuracy.
Altogether, the galaxy population dominating the faint mid-IR counts and
substantially
contributing to the bolometric CIRB intensity (assumed typical SB SEDs)
appears to be composed of luminous (Lbol ![]() 1011 - 1012 L
1011 - 1012 L![]() )
starbursts in massive (M
)
starbursts in massive (M ![]() 1011 M
1011 M![]() ) galaxies at
z
) galaxies at
z ![]() 0.5 - 1,
observed during a phase of active stellar formation.
The typically red colors of these systems suggest that they are mostly
unrelated to
the faint blue galaxy population dominating the optical counts
(Ellis 1997),
and should be considered as an independent manifestation of (optically
hidden) star formation
(Elbaz 1999;
Aussel 1998).
0.5 - 1,
observed during a phase of active stellar formation.
The typically red colors of these systems suggest that they are mostly
unrelated to
the faint blue galaxy population dominating the optical counts
(Ellis 1997),
and should be considered as an independent manifestation of (optically
hidden) star formation
(Elbaz 1999;
Aussel 1998).
12.2. What are the FIRBACK 175 µm sources?
The nature of the 175 µm sources discovered by
FIRBACK/ISO, and contributing
![]() 10% of the CIRB intensity, is presently the target of
intense observational and
modellistic investigations, although no conclusions are possible at the
moment.
Because of the missing knowledge of the LLF, the interpretation of the
175µm counts themselves is subject to some
uncertainties: is there strong or marginal evidence for evolution at the
survey limit of 100 mJy (Fig. 6)?
Dole et al. (2000)
argue in favour of the former,
while Fig. 6 reports a solution in
which a moderate-redshift (z
10% of the CIRB intensity, is presently the target of
intense observational and
modellistic investigations, although no conclusions are possible at the
moment.
Because of the missing knowledge of the LLF, the interpretation of the
175µm counts themselves is subject to some
uncertainties: is there strong or marginal evidence for evolution at the
survey limit of 100 mJy (Fig. 6)?
Dole et al. (2000)
argue in favour of the former,
while Fig. 6 reports a solution in
which a moderate-redshift (z ![]() 0.5)
population still dominates there.
0.5)
population still dominates there.
The basic limitation comes from the difficulty to identify the optical counterparts, due to the large (40 arcsec) ISOPHOT error-box. Progress is being achieved by cross-correlating with deep radio surveys available in the FIRBACK fields (exploiting the good radio/FIR correlation, eq. 6.14) and by means of some limited SCUBA follow-up. Scott et al. (2000) have obtained data at 450 and 850 µm for 10 FIRBACK sources: the FIR-mm SEDs tentatively indicate, for plausible far-IR spectra, redshifts in the range from 0 to 0.4 for the majority of the sources, while a few may be at z > 1.
Mid-IR 15 µm fluxes from an ISOCAM map are available
in the "FIRBACK Marano"
area, which indicate that the 15µm counterparts of
the 175µm sources are rather faint
(Elbaz, 1999).
Three interpretations have been suggested: (a) FIRBACK sources are
typically very high-luminosity Arp220-like at low redshift (z ![]() 0.1-0.4);
(b) they are more standard starbursts at z > 1;
(c) they are low-activity spirals at moderate z with significant
amounts of cold-dust and excess emission at
0.1-0.4);
(b) they are more standard starbursts at z > 1;
(c) they are low-activity spirals at moderate z with significant
amounts of cold-dust and excess emission at
![]() > 100µm.
> 100µm.
Although the results of the SCUBA observations might indicate that the last interpretation could be more probable, the nature of the FIRBACK source population is far from proven, further multi-wavelength data being required to address it. Deeper far-IR observations will be possible with SIRTF, but a more final solution will probably require the FIRST's better spatial resolution.
12.3. The nature of the high-z galaxies detected in the millimeter
Thanks to the unique advantage for deep sub-mm observations offered by the very peculiar K -correction, sub-mm surveys with sensitivities of few mJy at 850µm, have been able to detect high-redshift (very luminous) sources in flux-limited samples. The observed 850 µm counts, far in excess of the no-evolution prediction, already tell incontrovertibly about the cosmological distance and evolutionary status of the SCUBA-selected source population.
Unfortunately, probing directly the nature of these objects via optical
identification and spectroscopic follow-up turned out to be very difficult,
in spite of the substantial efforts dedicated. The SCUBA
diffraction-limited HPBW at 850 µm is large, ![]() 15 arcsec FWHM, and the
difficulty of the identification is further exacerbated by the usual extreme
faintness of the optical counterparts, as demonstrated in the (few)
cases in which the identification has been possible (see e.g.
Figure 13).
15 arcsec FWHM, and the
difficulty of the identification is further exacerbated by the usual extreme
faintness of the optical counterparts, as demonstrated in the (few)
cases in which the identification has been possible (see e.g.
Figure 13).
|
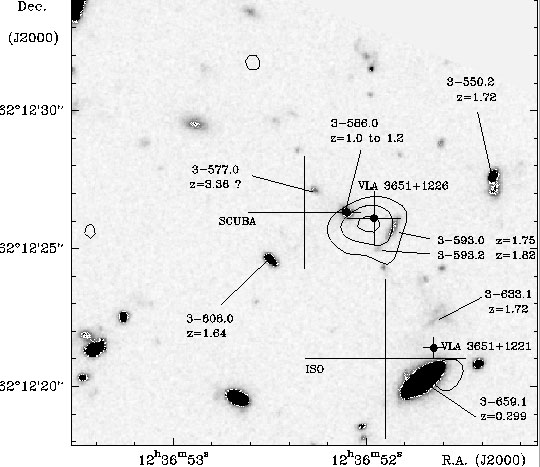
Figure 13. Map of the 1.3 mm continuum obtained with the IRAM interferometer in the field of the source HDF 850.1 by Downes et al. (1999). HDF 850.1 is the brightest source discovered at 850 µm by SCUBA (Hughes et al. 1998), and has a flux density of 2.2 mJy at 1.3 mm. The field center coincides with the center position of the SCUBA error-box, whose size is however comparable to the whole image area. The colour image is a composite of BVI data from HDF. Positions of VLA and ISO sources, as well as photometric redshift data, are also indicated. IRAM and VLA position clearly point to a faint optical counterpart of HDF 850.1 (3-593.0), possibly influenced by gravitational lensing by the elliptical 3-586.0, in a similar configuration to the prototypical primeval galaxy IRAS F10214 [courtesy of D. Downes]. |
The reliability of the identification has been evaluated
by computing the probability that the nearest member of a population of
candidate identifications with surface density n falls by chance
within a distance d from the SCUBA source:
P = e- ![]() nd2.
For a sample of size N of SCUBA detections, the product NP
gives the number of spurious identifications
(Lilly et al. 1999).
This analysis has shown that the situation is not quite comfortable for
the SCUBA surveys, essentially because of the
faintness of the optical counterparts: roughly 50% of all
identifications may be spurious.
nd2.
For a sample of size N of SCUBA detections, the product NP
gives the number of spurious identifications
(Lilly et al. 1999).
This analysis has shown that the situation is not quite comfortable for
the SCUBA surveys, essentially because of the
faintness of the optical counterparts: roughly 50% of all
identifications may be spurious.
Two approaches have been followed to improve the identification and try to characterize the population. One was to systematically survey spectroscopically all optical sources falling in the SCUBA beam, the other was to exploit cross-identifications with ultra-deep radio catalogues. Particularly well studied are the fields in the Cluster Lens Survey (Smail et al. 1997), exploiting the flux-amplification by massive foreground galaxy clusters. The current situation about redshift measurements in this survey is: the 16 SCUBA sources have 24 possible counterparts with spectroscopic redshifts, 6 reliable z estimates (a z = 2.8 combined AGN/starburst, a z = 2.6 galaxy pair, 2 galaxies with AGN signatures at z = 1.16 and z = 1.06, and finally 2 foreground cD cluster members [Barger et al. 1999]). Note that the identification with the galaxy pair has been later confirmed by CO mm observations (Frayer et al. 1999).
An interesting case is illustrated in Fig. 13,
showing the brightest object HDF-850.1 in the
Hughes et al. (1998)
survey, confirmed by IRAM interferometry as a probable
ultra-luminous lensed starburst with
Lbol ![]() 2 1012L
2 1012L![]() at
zphotom
at
zphotom ![]() 1.7
1.7
The difficulty of the identification process is illustrated by the
recent finding
(Smail et al. 1999)
of the presence of two Extremely Red Objects (ERO's) as probable
counterparts of two SCUBA sources.
Given the faintness of optical counterparts and the extreme difficulty
to get the redshift from optical spectroscopy, some millimetric
estimators of the redshift have been devised to override optical
measurements.
Hughes et al. (1998)
use the S450 / S850 flux ratio as a
measure of z.
However, given the rather wide temperature-distribution of cosmic dust
(see e.g. the
three quite different spectral templates, for Arp 220, M82, and M51 in
Fig. 9), this test proved to be very
uncertain. Much more reliable the technique proposed by
Carilli & Youn (1999)
to exploit the S850![]() /S20cm flux ratio,
which has the advantage to rely on very robust
mm spectral shapes at 850 µ (S
/S20cm flux ratio,
which has the advantage to rely on very robust
mm spectral shapes at 850 µ (S![]()
![]()
![]() , see Sect. 3)
and in the radio (typical power-law synchrotron spectra), with opposing
spectral slopes. Assuming an Arp 220 spectral template they got:
, see Sect. 3)
and in the radio (typical power-law synchrotron spectra), with opposing
spectral slopes. Assuming an Arp 220 spectral template they got:
|
whose small scatter mostly reflects the tight FIR to radio correlation.
Population constraints on the z-distributions have been derived
in this way,
and the basic result (still tentative and requiring confirmation) is that
faint SCUBA sources are mostly ultra-luminous galaxies at typical
z ![]() 1 to
1 to ![]() 3 (e.g.
Barger et al. 1999).
Clearly, the details of the z-distribution cannot yet be quantified with
precision,
this will likely require new instrumentation (mm interferometers -
e.g. ALMA - are particulalry needed, in addition to space FIR
observatories).
3 (e.g.
Barger et al. 1999).
Clearly, the details of the z-distribution cannot yet be quantified with
precision,
this will likely require new instrumentation (mm interferometers -
e.g. ALMA - are particulalry needed, in addition to space FIR
observatories).
As suggested by many authors, the similarity in properties between this
high-z population and local ultra-luminous IR galaxies argues in favour
of the idea that these represent the long-sought "primeval galaxies",
those in particular originating the local massive elliptical and S0
galaxies. This is also supported by estimates of the volume density of these
objects in the field
![]() 2 - 4 × 10⁻⁴ Mpc-3,
high enough to allow most of the field E/S0 to be formed in this way
(Lilly et al. 1999).
As for the E/S0 galaxies in clusters, a very interesting result was the
recent discovery by SCUBA of a significant excess of very luminous
(L
2 - 4 × 10⁻⁴ Mpc-3,
high enough to allow most of the field E/S0 to be formed in this way
(Lilly et al. 1999).
As for the E/S0 galaxies in clusters, a very interesting result was the
recent discovery by SCUBA of a significant excess of very luminous
(L ![]() 1013L
1013L![]() ) sources at
850 µm
close to the z = 3.8 radiogalaxy 4C41.17
(Ivison et al. 2000),
which parallels
the evidence of a similar excess of EROs and Lyman-break galaxies in
this area. It is tentalizing to interprete these data as indicative of
the presence of a
forming cluster surrounding the radiogalaxy, where the SCUBA sources
would represent the very luminous ongoing starbursts.
) sources at
850 µm
close to the z = 3.8 radiogalaxy 4C41.17
(Ivison et al. 2000),
which parallels
the evidence of a similar excess of EROs and Lyman-break galaxies in
this area. It is tentalizing to interprete these data as indicative of
the presence of a
forming cluster surrounding the radiogalaxy, where the SCUBA sources
would represent the very luminous ongoing starbursts.
By continuity, the less extreme starbursts (L ![]() 1011 - 1012 L
1011 - 1012 L![]() )
discovered by ISOCAM at lower redshifts can possibly originate the
spheroidal
components in later morphological type galaxies (see more in
Sect. 13.2.4 below).
)
discovered by ISOCAM at lower redshifts can possibly originate the
spheroidal
components in later morphological type galaxies (see more in
Sect. 13.2.4 below).
12.4. AGN contribution to the energetics of the faint IR sources
Within this interpretative scheme, a margin of uncertainty still exists
about the possible contribution
by gravitational accretion from a nuclear quasar to the energy budget in
these high-z IR-mm sources.
While stellar energy production provides a modest overall efficiency for
baryon transformations of quite less
than a percent at most, the theory of gravitational accretion predicts
values in the range
![]()
![]() 5 - 40%. A natural question then arises as of how much
of the bolometric flux in these sources is contributed by an AGN.
Unfortunately, the optical-UV-soft-X ray primary source spectrum
in the high-redshift IR-mm sources is almost completely re-processed by
dust into an IR spectrum largely insensitive to the properties of the
primary incident one.
5 - 40%. A natural question then arises as of how much
of the bolometric flux in these sources is contributed by an AGN.
Unfortunately, the optical-UV-soft-X ray primary source spectrum
in the high-redshift IR-mm sources is almost completely re-processed by
dust into an IR spectrum largely insensitive to the properties of the
primary incident one.
As for SCUBA sources, there have been indications for AGN activity for at least a fraction (20-30%) of them. Indeed, since SCUBA selects the top luminosity end of the IR population, and considering the local evidence of a larger incidence of AGNs among ULIRGs, an important AGN contribution to the SCUBA sources would be expected (potentially biasing our conclusions about their contribution to the SFR history). Risaliti et al. (2000) and Bassani et al. (2000) claim evidence for a significant AGN contribution in the large majority (> 60%) of the local ULIRGs based on hard X-ray data, something confirmed also by high spatial resolution IR imaging by Soifer et al. (2000).
Since its launch the last year, the CHANDRA X-ray observatory (the ultimate imager in hard X-rays) has allowed to probe very deeply into the nature of the high-z SCUBA sources, using the hard X-ray flux as diagnostic tool (SB are weaker X-ray emitters than any kind of AGNs). Among several tens of hard X-ray and 850 µm sources detected in various independent survey areas, (Fabian et al. 2000, Hornschemeier et al. 2000, Barger et al. 2000), only very few are in common, the two samples being essentially orthogonal. Unless all these are Compton-thick and any hard X-ray scattered photons are also photoelectrically absorbed, the conclusion is that the bulk of the emission by high-luminosity SCUBA sources is due to star formation (in agreement with a dominant stellar emission in local ULIRGs found by Genzel et al. 1998).
While the detailed interplay between starburst and AGN
is still an open issue even for local sources, the estimated fraction of
the CIRB at 850 µm due to AGNs is not larger than 10%
(Barger et al. 2000).
Preliminary results of spectroscopic studies of the H![]() line properties
in faint ISO mid-IR sources
(D. Rigopoulou, private communication) seem also to indicate a modest
incidence of AGN,
which would imply that the overall AGN contribution to the bolometric
CIRB is likely around 10% or so.
line properties
in faint ISO mid-IR sources
(D. Rigopoulou, private communication) seem also to indicate a modest
incidence of AGN,
which would imply that the overall AGN contribution to the bolometric
CIRB is likely around 10% or so.
ISO and SCUBA surveys have proven nicely complementary capabilities to
explore, within the limitations of the current instrumentation,
long-wavelength emission
by galaxies over most of the Hubble time, up to z of several.
Unfortunately, this has been possible only at the short- and
long-wavelength tails of the CIRB background spectrum:
a bad coincidence makes the wavelength interval including peak emission
by distant dusty galaxies (![]()
![]() 30 to 300 µm) hardly accessible at
present.
30 to 300 µm) hardly accessible at
present.
All mentioned exploratory surveys of the distant universe have indicated
that the overall volume
emissivity of galaxies at long wavelengths drastically increases as a
function of
redshift, to explain the very steep observed multi-wavelength counts and the
redshift distributions showing substantial high-z tails.
This evolution, however, should level off by z ![]() 1 (see Fig. 14 below)
to allow consistency with the observed z-distributions
(Franceschini et al. 2000)
and the CIRB spectral shape.
1 (see Fig. 14 below)
to allow consistency with the observed z-distributions
(Franceschini et al. 2000)
and the CIRB spectral shape.
A spectacular finding by the deep SCUBA surveys was the discovery of
ultra-luminous
galaxies at high-redshifts, mostly emitting in the far-IR and possibly
at the origin of present-day galaxy spheroids.
However, the most precise quantification of the cosmic history of the IR
population comes at the moment from the ISO
deep and ultra-deep surveys, which provide very detailed constraints on
the counts
(Fig. 5) and also allow to
unambiguously identify in the optical the
faint IR sources (Fig. 4).
The outcome of our spectroscopic observations is that the faint population
making up the CIRB in the mid-IR is dominated by actively star-forming
galaxies with substantial H![]() emission (Sect. 12.1.1). Preliminary inspection of H
emission (Sect. 12.1.1). Preliminary inspection of H![]() line profiles and constraints set by the 15 to 7
micron flux ratio
indicate that the majority of sources are powered by a SB rather than an
AGN.
line profiles and constraints set by the 15 to 7
micron flux ratio
indicate that the majority of sources are powered by a SB rather than an
AGN.
Mid-IR ISO counts and the redshift distributions of the sources require
extremely high rates of evolution of the 15µm luminosity
function up to z ![]() 1.
Taking into account all effects due to the detector spectral response
function
to the complex mid-IR spectral features, the observable statistics may
be explained
in terms of a strong evolution for a population of IR starbursts
contributing little to the local LF. Consequently, a plausible evolution
pattern should involve both the source luminosities and spatial densities.
1.
Taking into account all effects due to the detector spectral response
function
to the complex mid-IR spectral features, the observable statistics may
be explained
in terms of a strong evolution for a population of IR starbursts
contributing little to the local LF. Consequently, a plausible evolution
pattern should involve both the source luminosities and spatial densities.
A natural way to account for this very high dependence on redshift of the IR starburst population is to assume that it consists of otherwise normal galaxies, but observed during a dust-extinguished luminous starburst phase, and that its extreme evolution is due to an increased probability with z to observe a galaxy during a starburst event.
The common wisdom that SBs are triggered by interactions and merging
suggest that the inferred strong number density evolution
may be interpreted as an increased probability of interaction
with z. Assuming that the phenomenon is dominated by interactions in the
field and a
velocity field constant with z, than this probability would scale
roughly as
![]() n(z)2
n(z)2 ![]() (1 + z)6, n being the number
density in the proper (physical)
volume. A more complex situation is likely to occur, as the velocity
field evolves with z
in realistic cosmological scenarios and if we consider that the most
favourable environment for interactions are galaxy groups, which indeed are
observed to include the majority of ISOCAM distant sources
(Cohen et al. 1999).
The increased luminosity with z of the typical starburst is due,
qualitatively, to the larger amount of gas available in the past to make
stars.
(1 + z)6, n being the number
density in the proper (physical)
volume. A more complex situation is likely to occur, as the velocity
field evolves with z
in realistic cosmological scenarios and if we consider that the most
favourable environment for interactions are galaxy groups, which indeed are
observed to include the majority of ISOCAM distant sources
(Cohen et al. 1999).
The increased luminosity with z of the typical starburst is due,
qualitatively, to the larger amount of gas available in the past to make
stars.
To note is that closed or zero-![]() world models require evolution
rates quite in excess of those inferred from deep optical imaging
(Le Fevre et al. 2000),
whereas our best-fit solution for
world models require evolution
rates quite in excess of those inferred from deep optical imaging
(Le Fevre et al. 2000),
whereas our best-fit solution for
![]() = 0.8 and
= 0.8 and
![]() = 0.2
(eq. 11.28]) is closer to the optical results.
= 0.2
(eq. 11.28]) is closer to the optical results.
How this picture of a 2-phase evolution of faint IR sources compares
with results of optical and near-IR deep galaxy surveys is matter of debate.
Since, because of dust, most of the bolometric emission during a
starburst comes out in the far-IR, we would not expect the optical
surveys to see much of this violent IR
starbursting phase. Indeed, B-band counts of galaxies and spectroscopic
surveys are interpreted in
terms of number-density evolution, consequence of merging, and
essentially no evolution in luminosity.
The Faint Blue Object population found in optical surveys may be
interpreted as the "post-starburst" population, objects either observed
mostly after the major event of SF,
or more likely ones in which the moderately extinguished intermediate age (
![]() 107 yrs)
stars in a prolonged starburst (several 107 yrs)
dominate the optical spectrum.
In this sense optical and far-IR selections trace different phases of
the evolution of
galaxies, and provide independent sampling of the cosmic star formation.
107 yrs)
stars in a prolonged starburst (several 107 yrs)
dominate the optical spectrum.
In this sense optical and far-IR selections trace different phases of
the evolution of
galaxies, and provide independent sampling of the cosmic star formation.
A lively debate is currently taking place about the capabilities of UV-optical observations to map accurately by themselves the past and present star-formation, based on suitable corrections for dust extinction in distant galaxies. Adelberger et al. (2000) suggest that the observed 850 µm galaxy counts and the background could possibly be explained with the optical Lyman drop-out high-z population by applying a proportionality correction to the optical flux and by taking into account the locally observed distribution of mm-to-optical flux ratios.
On the other hand, a variety of facts indicate that optically-selected and IR/mm-selected faint high-redshift sources form almost completely disjoint samples. Chapman et al. (2000) observed with SCUBA a subset of z = 3 Lyman-break galaxies having the highest estimeted rates of SF as inferred from the optical spectrum, but detected only one object out of ten. For this single detected source the predicted SFR based on the extinction-corrected optical spectrum was 5 times lower than found by SCUBA. A similar behaviour is also shared by local luminous IR galaxies, whose bolometric flux is unrelated to the optical spectrum (Sanders & Mirabel 1996).
Finally, our previously mentioned observational results by Rigopoulou et al. (2000) and the theoretical ones by Poggianti & Wu (2000) and Poggianti et al. (2001) report independent evidence from both local and high-z luminous starbursts that typically 70% to 80% of the bolometric flux from young stars leaves no traces in the UV-optical spectrum, because it is completely obscured by dust. As there seems to be no "a priory" way to correct for this missing energy, we conclude that only long-wavelength observations, with the appropriate instrumentation, can eventually measure SF in galaxies at any redshifts.