Copyright © 1997 by Annual Reviews. All rights reserved
| Annu. Rev. Astron. Astrophys. 1997. 35:
267-307 Copyright © 1997 by Annual Reviews. All rights reserved |


Our ignorance of the true galaxy population affects virtually every aspect of observational cosmology. Study of the detailed properties of galaxies is confined to nearby, prominent examples. Beyond the Milky Way, most of our information on the stellar populations, kinematics, dark matter content, star formation history, and large scale clustering of galaxies is based on studies of high surface brightness objects. Without accounting for LSB galaxies, we cannot complete a census of the luminous density and matter content of the universe.
4.1. Light and Matter in the Universe
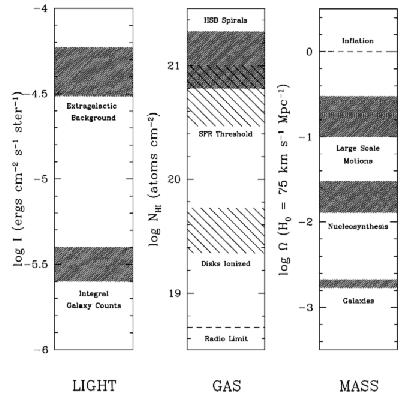
There are reasons to believe that the existing census of galaxies is incomplete. Figure 3 shows current constraints on luminous and nonluminous material in the universe. The left-hand panel shows the integrated surface intensity of the galaxy counts down to V = 27 (Tyson 1995). The sum is dominated by counts well above the magnitude limit of the survey, and this is nearly an order of magnitude lower than the upper bound on the extragalactic part of the diffuse sky brightness (Mattila 1990). The center panel of Figure 3 shows HI column density, where bright spirals have a peak HI column density in the range 5 × 10²⁰ < NHI < 2 × 10²¹ atoms cm-2 (Warmels 1985, Cayette, Kotanyi & Balkowski 1993). At lower HI column densities, 3 × 10²⁰ < NHI < 8 × 10²⁰ atoms cm-2, the efficiency of star formation is greatly reduced (Kennicutt 1989, van der Hulst et al 1993). At still lower column densities, disks may be ionized, and such diffuse gas clouds may not be detectable with HI surveys (Maloney 1993).
|
Figure 3. The left panel shows the intensity of diffuse extragalactic light. The integral of the faint galaxy counts (Tyson 1995) is nearly an order of magnitude below the observations upper bound (Mattila 1990). The center panel shows the HI column density of gas in galaxies. Superimposed are the range of column densities for normal luminous spirals (Cayette, Kotanyi & Balkowski 1993), the range of the threshold column density below which star formation is inefficient (Kennicutt 1989), and the probable column density at which disks in the local universe are ionized (Maloney 1993). The right panel shows mass components in the universe as a fraction of the critical density. The upper band is the range from large scale motions (e.g. Peebles 1993), the middle band is the rang from nucleosynthesis arguments (Walker et al 1991), and the lower band is the observed contribution in luminous galaxies (Persic & Salucci 1992). |
The right-hand panel of Figure 3 shows various
measures of the mean mass density,
 0. The agreement
between the observed abundances of light elements and the
predictions of primordial nucleosynthesis is one of the great successes of
standard cosmology
(Walker et al 1991).
Yet, a careful accounting of the visible material in
and between galaxies shows that it falls short of matching the amount of
baryonic material predicted by the big bang model
(Persic & Salucci
1992).
For an allowed range of nucleon densities,
2.8 × 10¹⁰ < nbaryon /
n
0. The agreement
between the observed abundances of light elements and the
predictions of primordial nucleosynthesis is one of the great successes of
standard cosmology
(Walker et al 1991).
Yet, a careful accounting of the visible material in
and between galaxies shows that it falls short of matching the amount of
baryonic material predicted by the big bang model
(Persic & Salucci
1992).
For an allowed range of nucleon densities,
2.8 × 10¹⁰ < nbaryon /
n <
4.0 × 10¹⁰,
Walker et al (1991)
find the constraint on the baryon density parameter to be
0.010 < baryon
h1002 < 0.015.
<
4.0 × 10¹⁰,
Walker et al (1991)
find the constraint on the baryon density parameter to be
0.010 < baryon
h1002 < 0.015.
The visible contribution from baryons is given by the sum
baryon =
E/S0 +
Sp +
clusters +
groups,
where the results of the Gunn-Peterson test put a very low limit on any
diffuse component of cold intergalactic hydrogen. The inventory by
Persic & Salucci
(1992)
yields a total of
baryon = (2.2 +
0.6h100-3/2) × 10-3, so
that most baryons must be dark for
0.5 < h100 < 1. X-ray
observations of rich clusters imply
baryon /
tot ~ 0.1-0.3 (e.g.
White et al 1993).
Since inhomogeneous nucleosynthesis cannot be used
to raise the baryon density above
baryon ~
0.1h1002
(Malaney & Mathews
1993),
this observation is difficult to understand unless the standard
scenario of a flat universe is incorrect; see the extensive discussion of
baryonic dark matter by
Carr (1994).
LUMINOSITY DENSITY For cosmological purposes, the integrated luminosity density is more important than the integrated number density. It is also a more robust way of comparing galaxy samples than by Schechter function parameters (assuming that the integral has converged 3-4 magnitudes (mag) below L*, when the incompleteness of most samples becomes large). For the CfA survey (Marzke et al 1994a),

| (9) |
A variation of nearly a factor of two is seen
between this and other published values for the luminosity density;
Efstathiou et al (1988)
found 19 ± 7 × 10⁷ h100
L Mpc-3,
Loveday et al (1992)
found 15 ± 3 × 10⁷ h100
L
Mpc-3, and
Lin et al (1996)
found 19 ± 1 × 10⁷ h100
L
Mpc-3. From the APM survey of late-type LSB galaxies,
Sprayberry et al (1997)
derive 3 ± 0.5 × 10⁷ h100
L
Mpc-3.
This exceeds the luminous density of late type irregulars found by
Marzke et al (1994a),
and is 15-30% of the luminous density for all morphological types found
by all investigators.
Dalcanton et al (1997a)
reached similar conclusions based on a smaller number of redshifts from
a CCD survey; LSB galaxies contribute 10-100%
of the luminous density seen in HSB galaxies. The LSB correction to the
luminosity density is only valid over the range
22 < µ0 < 25 mag arcsec-2 , and
this correction must be a lower limit because the surface brightness
distribution is nearly flat down to the limits of current observations.
Mpc-3,
Loveday et al (1992)
found 15 ± 3 × 10⁷ h100
L
Mpc-3, and
Lin et al (1996)
found 19 ± 1 × 10⁷ h100
L
Mpc-3. From the APM survey of late-type LSB galaxies,
Sprayberry et al (1997)
derive 3 ± 0.5 × 10⁷ h100
L
Mpc-3.
This exceeds the luminous density of late type irregulars found by
Marzke et al (1994a),
and is 15-30% of the luminous density for all morphological types found
by all investigators.
Dalcanton et al (1997a)
reached similar conclusions based on a smaller number of redshifts from
a CCD survey; LSB galaxies contribute 10-100%
of the luminous density seen in HSB galaxies. The LSB correction to the
luminosity density is only valid over the range
22 < µ0 < 25 mag arcsec-2 , and
this correction must be a lower limit because the surface brightness
distribution is nearly flat down to the limits of current observations.
EXTRAGALACTIC BACKGROUND LIGHT The extragalactic background light (EBL) is an integral sum of the star formation history of the universe, more sensitive in practice to galaxy evolution than to the parameters of the cosmological model (Harrison 1964). It also provides a fundamental limit to the potential profusion of LSB galaxies. The observed upper limit on the diffuse EBL is subject to the accurate elimination of foreground components that are several hundred times larger; Mattila, Leinart & Schnur (1991) summarize a number of measurements which yield upper limits in the range 4.5-10 × 10-9 erg cm-2 s-1 ster-1 Å-1. The integral of the number counts of galaxies down to a B band isophote of 30 mag arcsec-2 (Tyson 1995) is

| (10) |
The corresponding number from the survey of Cowie, Hu & Songaila (1995b) is 4 × 10⁻¹⁰ erg cm-2 s-1 ster-1 Å-1. These measurements with their uncertainties are shown in the left panel of Figure 3.
The existing limits on the EBL allow for large populations of LSB galaxies; note, however, that they are not present in large numbers in the deep CCD data (Tyson 1995). Väisänen (1996) concluded that populations of LSB galaxies permitted by the number counts can raise the EBL by a factor of 2-3. Models which include large numbers of LSB dwarfs lead to a predicted EBL within a factor of two of the current limit (Ferguson & McGaugh 1995, Morgan & Driver 1995). Depending on the evolution model assumed, the steep faint end tail of the local luminosity function discussed previously would not contribute to the pencil-beam counts until B ~ 26, substantially fainter that the level of the peak contribution of the counts to the EBL, B ~ 24. Since LSB galaxies are largely quiescent, their existence in large numbers would not violate the constraint that we have already identified the sources of most of the metal production in the universe (Cowie 1988). The directly meaured contribution of LSB galaxies from the APM survey is 2 × 10⁻¹⁰ erg cm-2 s-1 ster-1 Å-1, or 30-50% of the amount from the integral number counts.
A separate constraint comes from the fluctuations in the EBL (Schectman 1974). Note that LSB galaxies can add to the level of the EBL without increasing the amplitude of the fluctuations, because they are observed to be weakly clustered (Mo, McGaugh & Bothun 1994). It is possible to use the correlation properties of the extragalactic background to constrain galaxy evolution models (Cole, Treyer & Silk 1992). However, this type of analysis must take into account that a significant fraction of the background from discrete sources is at much lower redshifts than the galaxies seen in deep pencil beam surveys, and that LSB galaxies are more readily detected in pencil beam surveys than in wide field surveys.
GAS MASS DENSITY Galaxy evolution proceeds by the conversion of gas into stars. There is ample evidence that the census of diffuse galaxies as measured by their light is incomplete. However, the search for gas through the 21 cm emission line offers a complementary approach. Radio telescopes have been used not only to measure the gas contents of cataloged galaxies, but to place limits on the space density of intergalactic clouds of neutral hydrogen (Fisher & Tully 1977). For a source larger than the beam,
| (11) |
where t is the integration time,
 V in kms-1
is the bandwidth in terms of the antenna equation or the velocity
dispersion of the gas for a galaxy, and
(NHI)lim is independent of telescope size
because telescope area and beam size cancel
(Disney & Banks 1997).
For sources smaller than the beam, the visibility volume is given by
V in kms-1
is the bandwidth in terms of the antenna equation or the velocity
dispersion of the gas for a galaxy, and
(NHI)lim is independent of telescope size
because telescope area and beam size cancel
(Disney & Banks 1997).
For sources smaller than the beam, the visibility volume is given by
| (12) |
where t is the integration time per pointing or beam, which means that the typical observing strategy is to maximize the observable volume with short integrations and a shallow survey. As a consequence, very little is known about the HI content below a column density of NHI ~ 1019 atoms cm-2. There is a rough scaling NHI ~ 1020(MHI / LB)100.4(27 - µB) atoms cm-2 (Disney & Banks 1997), such that galaxies from most HI surveys should be readily detectable on POSS II or UKST survey plates, and galaxies with either NHI < 1019 atoms cm-2 or µe > 27 mag arcsec-2 are extremely difficult to detect by any technique.
Published radio surveys have a number of limitations. The sensitivity
to HI masses below 108
M
is poor, and the small beam sizes and limited
bandwidths allow relatively small volumes to be probed, with
correspondingly weak limits on rare objects. Interferometers gain over
single dishes by the number
of beams per field of view, but lose bandwidth due to the need for
n(n - 1)
correlators, where n is the number of telescopes in the
array. Equally
important is the region of space targeted. Most surveys have targeted
optically-selected galaxies, which involves a bias towards those galaxies
that have been most efficient in forming stars. Other surveys target
optically bright galaxies, but are sensitive to HI signals elsewhere in
the velocity bandwidth, or in the "off" beams. This prejudices the
sample to the immediate
environments of bright galaxies, which may be atypical. Many HI surveys are
confined to the Local Supercluster, a volume which is overdense by a factor
of ~ 2.3 compared to the cosmic average
(Felten 1977).
There have been relatively few unbiased HI surveys.
Schneider et al
(1990,
1992)
have published extensive HI surveys, including
observations of many dwarf and LSB galaxies (mostly from the UGC catalog).
Rao & Briggs (1993)
have calculated the HI mass function of late-type galaxies over the range
107 < MHI < 1010
M using the
surveys of
Fisher & Tully
(1981) and
Hoffman et al (1989).
Other "blind" surveys have been used to quantify
the space density of gas-rich dwarfs
(Weinberg et al 1991,
Szomoru et al 1994)
and giants
(Briggs 1990).
The HI mass function has an analogous form to the Schechter luminosity
function
| (13) |
where the extra component is the trend of HI richness with luminosity
MHI / L
 L
L . Studies
of spiral and irregular galaxies indicate
. Studies
of spiral and irregular galaxies indicate
 - 0.1
(Fisher & Tully 1975),
and when is small the shape
of the HI mass function and the optical luminosity function are very
similar
(Rao & Briggs 1993).
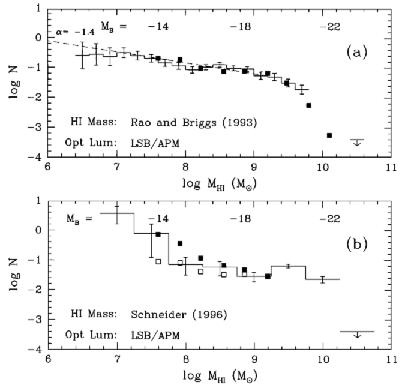
Figure 4a shows a direct comparison between the
Rao & Briggs mass function and the count of LSB galaxies from the
APM survey, normalized at MB = - 21 or
MHI = 3 × 10⁹
M. Both
functions are consistent with a faint end slope corresponding to
- 0.1
(Fisher & Tully 1975),
and when is small the shape
of the HI mass function and the optical luminosity function are very
similar
(Rao & Briggs 1993).
Figure 4a shows a direct comparison between the
Rao & Briggs mass function and the count of LSB galaxies from the
APM survey, normalized at MB = - 21 or
MHI = 3 × 10⁹
M. Both
functions are consistent with a faint end slope corresponding to
 = - 1.4 in a Schechter
parametrization.
= - 1.4 in a Schechter
parametrization.
|
Figure 4. (a) The HI mass function and the LSB galaxy number distribution superimposed, using the mean realationship between light and gas mass from the APM LSB survey, normalized at MB = - 21. (From Rao & Briggs 1993, Impey et al 1996, Sprayberry et al 1997). (b) As above, with the HI mass function taken from a deep Arecibo survey. The open squares are the APM counts of LSB galaxies as in (a), the filled squares show the counts using a correction for censored regions in the surface brightness-luminosity plane. (Sources as above, in both cases the limit on high HI mass Malin 1-type galaxies is from Briggs 1990.) |
Figure 4b shows the mass function from a
sensitive Arecibo HI survey
(Schneider 1996),
with the luminosity function of the LSB galaxies from the APM survey
superimposed. Optical luminosity is mapped onto HI mass for the APM
sample by the relation
MHI = 1010 - (MB + a)/b
M, with
a = 21.7 and b = 3.16, which accounts for the fact that
the galaxies are optically
selected, and so the distribution is censored at low values of
MHI
for a given luminosity. This relationship agrees well with the slope (to
10%) and the normalization at 108
M (to 50%)
of the relationships adopted by
Briggs (1990),
a = 20.3 and b = 2.78, and
Tyson & Scalo (1988),
a = 20.9 and b = 3.12. LSB galaxies are a factor of ~ 2
more gas-rich at a given luminosity than HSB galaxies. The two functions
are normalized at MHI = 3 × 10⁹
M where the
HI survey is reasonably complete.
The HI mass function shows a clear upturn at
MHI ~ 108
M,
corresponding to MB ~ - 16, where the APM luminosity
function turns up with a faint end slope of
= - 1.4. At the high end of
the HI mass function,
Briggs (1990)
has put a limit on the space density of giant gas disks
like Malin 1 (also see
Bothun 1985).
With 95% confidence assuming Poisson statistics,
 < 4.1 ×
10-4 Mpc-3
(Weinberg et al 1991
have a weaker limit of
< 0.029
Mpc-3). This upper bound is weak enough
that objects like Malin 1 could contribute as much integrated gas
density as HI rich dwarfs with
MHI = 108
M. Several
thousand such galaxies could lie closer than the
prototype. Nevertheless, the cosmological conclusion
is that gas-rich LSB galaxies do not domnate the local gas mass density
of the universe.
< 4.1 ×
10-4 Mpc-3
(Weinberg et al 1991
have a weaker limit of
< 0.029
Mpc-3). This upper bound is weak enough
that objects like Malin 1 could contribute as much integrated gas
density as HI rich dwarfs with
MHI = 108
M. Several
thousand such galaxies could lie closer than the
prototype. Nevertheless, the cosmological conclusion
is that gas-rich LSB galaxies do not domnate the local gas mass density
of the universe.
MASS DENSITY IN BARYONS Even after correcting for surface brightness selection, the luminosity density is one step removed from the function of cosmological interest. The baryonic density is
| (14) |
where both the luminosity function and the baryonic mass-to-light
ratio  (L,
µ) = (M / L)baryon =
A(µ)(L /
L*)
(L,
µ) = (M / L)baryon =
A(µ)(L /
L*) are functions
of surface brightness. A large amount of uncertainty is hidden in the
normalization factor A(µ), because there is very
little data on the dependence of baryonic
M/L as a function of surface brightness. To simplify, we
can factor A out of the integral
are functions
of surface brightness. A large amount of uncertainty is hidden in the
normalization factor A(µ), because there is very
little data on the dependence of baryonic
M/L as a function of surface brightness. To simplify, we
can factor A out of the integral
| (15) |
where the surface brightness corrections to the luminosity function are
accounted for in terms of an increased normalization,
 *, and a steeper
faint end slope, . Following
Persic & Salucci
(1992),
we take the bounds of the integral as
0.01 < (L / L*) < 8.
Bristow & Phillipps
(1994)
plot the integrated mass function for different values of
,
, and
Lmin.
*, and a steeper
faint end slope, . Following
Persic & Salucci
(1992),
we take the bounds of the integral as
0.01 < (L / L*) < 8.
Bristow & Phillipps
(1994)
plot the integrated mass function for different values of
,
, and
Lmin.
To sharpen up the cosmological comparison, we use recent nucleosynthesis
constraints
(Copi, Schramm & Turner
1995),
and a Hubble constant bound of
0.5 < h100 < 0.8 which encompasses 95% of the
published values since 1995 (Kennicutt, private communication),
including the recent HST Key Project result of
H0 = 73 ± 10 kms-1 Mpc-1
(Freedman, Madore &
Kennicutt 1997).
Although we use a scaling to H0 = 100 km
s-1 Mpc-1 in this review, it is almost certain that
h100 < 1, and a number of direct distance
scale measurements indicate h100 < 0.7 (e.g.
Saha et al 1996,
Grogin & Narayan 1996).
The result is 0.014 <
baryon <
0.080, which may
increase by a factor of 2-3 if the D/H ratio proves to be
as low as 1-2 × 10⁻⁵. Most matter is nonbaryonic, and
most baryons have not yet been detected.
Given the uncertainties in this calculation, we quote only illustrative
results. For spirals,
Persic & Salucci
(1990)
derive A = 2.4h100(M /
L), whereas
McGaugh (1992)
derives A
5h100(M /
L) for LSB
spirals, a ratio of a factor of 2.1. Based on the APM survey
(Impey et al 1996),
we increase the normalization by a factor of 1.3. The product of these
two factors raises the spiral contribution by a factor of 2.7, and the
overall Persic & Salucci census by 40% to
baryon =
0.0042. The biggest leverage in the mass
density integral comes from faint and low mass galaxies.
Persic & Salucci
(1990)
assume values which make the exponent
1 + +
> 0, but if
1 + +
< - 1 the mass
integral rises rapidly. Adopting a faint end slope of
= - 1.4,
and assuming
0 (because LSB galaxies
appear to have higher M / L
and since luminosity and surface brightness are correlated),
baryon =
0.0062. If either = - 1.80, or
= - 0.5 (baryons
scale with dark matter), the correction factor becomes 3.6, with a total
baryon = 0.013.
Bristow & Phillipps
(1994)
use more extreme, but not implausible, values to deduce
baryon =
0.025. We conclude that LSB galaxies can easily
be the sites of much of the "missing" baryonic matter in the universe.
TOTAL MASS TO LIGHT RATIOS
Dynamical measures of the total mass-to-light ratios of LSB galaxies are
difficult to obtain. A small number of HI rotation curves of LSB giants
have been published
(de Blok, McGaugh, & van
der Hulst 1996),
but velocity dispersions for the LSB
dwarfs are beyond the capabilities of existing telescopes. There is
nonetheless indirect evidence that LSB galaxies have higher M /
L than HSB galaxies of the
same size. It has been found that LSB disks follow the same Fisher-Tully
relation as normal bright spirals, but with increased scatter
(Zwaan et al 1995,
Sprayberry et al 1995b).
If the mass M is proportional to
vmax2h, then
vmax4
M2 /
h2
M2I0 / L, since
L
I0h2.
Zwaan et al (1995)
found that LSB galaxies from the surveys of
McGaugh & Bothun
(1994),
Knezek (1993), and
de Blok, van der Hulst &
Bothun (1995)
have the same
luminosities at a fixed line width as the HSB galaxies observed by
Broeils (1992).
This implies M / L
I0-1/2. Although the scatter is large,
luminosity and central surface brightness are correlated for the APM
sample, with a dependence that scales as
L
I01/2. Using a projection of the
luminosity-surface brightness distribution that accounts for censored
galaxies, this flattens to L
I0. With this latter dependence M / L
L-1/2,
which gives LSB galaxies considerable leverage in the mass census of
disk systems.
Less can be said about the M / L of dwarf LSB galaxies in the field, because the galaxies are small and the HI line widths are narrow (10-30 km s-1), so the rotation curves are usually poorly sampled. The low surface mass density of the (mostly gas-poor) LSB dwarfs in clusters like Virgo and Fornax suggests a stability constraint. Assuming isotropic velocities, the mass density in the core of a rich cluster is
| (16) |
where  = 870
kms-1 and
rc = 0.2h100-1 Mpc
(Peebles 1993).
This number can be compared with the stellar mass density of a
typical LSB galaxy
= 870
kms-1 and
rc = 0.2h100-1 Mpc
(Peebles 1993).
This number can be compared with the stellar mass density of a
typical LSB galaxy
| (17) |
where n is the number of scale lengths considered, and
 is a shape parameter that describes the departure from spherical symmetry.
Adopting n = 3 (which includes 80% of the total light) and
= 0.3 leads to a
condition for the stability of the diffuse galaxy in the
tidal field of a cluster core
(M / L)LSB > 0.13(h3 /
Ltot), where h is in parsecs and
Ltot is in solar units. The envelope
of this distribution is of course defined by selection effects, which
mitigate against the combination of large scale length and low luminosity.
However, cluster LSB samples
(Impey, Bothun & Malin
1988;
Bothun, Impey, & Malin
1991;
Turner et al. 1993)
include galaxies whose long term existence
implies larger than expected mass-to-light ratios. The condition
M / L > 3 corresponds to h > 3 kpc at
MB = - 17 or h > 10 kpc at
MB = - 21. Finally, we note that the innocuous Local
Group dwarf spheroidals have
some of the highest M / L ratios of any galaxies
(Mateo 1996).
The galaxies that have been undercounted in all existing surveys are
those with the highest mass
fractions of gas and the the highest M / L ratios.
is a shape parameter that describes the departure from spherical symmetry.
Adopting n = 3 (which includes 80% of the total light) and
= 0.3 leads to a
condition for the stability of the diffuse galaxy in the
tidal field of a cluster core
(M / L)LSB > 0.13(h3 /
Ltot), where h is in parsecs and
Ltot is in solar units. The envelope
of this distribution is of course defined by selection effects, which
mitigate against the combination of large scale length and low luminosity.
However, cluster LSB samples
(Impey, Bothun & Malin
1988;
Bothun, Impey, & Malin
1991;
Turner et al. 1993)
include galaxies whose long term existence
implies larger than expected mass-to-light ratios. The condition
M / L > 3 corresponds to h > 3 kpc at
MB = - 17 or h > 10 kpc at
MB = - 21. Finally, we note that the innocuous Local
Group dwarf spheroidals have
some of the highest M / L ratios of any galaxies
(Mateo 1996).
The galaxies that have been undercounted in all existing surveys are
those with the highest mass
fractions of gas and the the highest M / L ratios.
Our understanding of how galaxies form and evolve is highly incomplete. Ironically, we know as much about the linear and high temperature physics during the first few minutes of the universe, through the successes of the hot big bang model (e.g. Peebles et al 1991), as we do about the billion years after density perturbations became nonlinear. Our ignorance of galaxy evolution has hampered tests of the deceleration parameter and the curvature of the universe (Sandage 1988). Reliable measures of ages and stellar populations can only be obtained for nearby, prominent galaxies. These same high surface brightness galaxies are used as probes of large scale structure in redshift surveys. The study of low surface brightness galaxies opens a new window onto galaxy formation and evolution.
THE COLORS OF LSB GALAXIES
The LSB dwarf galaxies in clusters are distinguished by their blue
colors and low gas contents. Imaging of sufficient resolution reveals
mostly dIm and dE morphologies. In Virgo and Fornax combined, the mean
colors are B - V = 0.58 ± 0.02 for 31 objects, and
V - I = 1.00 ± 0.03 for 23 objects
(Impey, Bothun, & Malin
1988;
Bothun, Impey, & Malin
1991).
Davies, Phillipps, &
Disney (1990)
found B - R
1.4 in Fornax, corresponding to a slightly redder
B - V
0.7. There is no simple explanation for these colors, which are similar
to the
colors of the most metal-poor galactic globular clusters. The lack of a
correlation between color and surface brightness argues against LSB
dwarfs being faded remnants of more gas-rich dwarfs. One scenario
identifies the diffuse stellar component as
a fossilized metal-poor remnant of a galaxy with a steadily softening
potential, where most of the gas was driven away long ago
(Dekel & Silk 1986).
Although the blue colors are consistent with a young median age,
spectroscopy is required to disentangle effects of age and metallicity.
Although fading is not indicated as a cause for the low surface
brightness, a red population of LSB galaxies cannot be ruled out. All of
the large area surveys have
been carried out in the blue, and a star-bursting dwarf could rapidly
redden and fade below threshold imposed by the night sky. A
107 year starburst with a conventional IMF would redden from
B - V = - 0.30 to
B - V = 0.50 after 109
years, whereas the total light fades by ~ 5 magnitudes
(Bruzual & Charlot
1993).
After 1010 years, the color reddens further to
B - V = 0.85 and the
total light fades another ~ 2 magnitudes. Assuming the galaxy fades with
constant scale length, a galaxy fading by
µ magnitudes is
lost more rapidly due to falling below the angular size limit (n
µ3)
than it is due to falling below the flux limit (n
10µ / 2.5).
Each factor of two of fading reduces the visibility volume by a factor
of eight. In addition, the sky contrast improves towards the blue for
all objects with B - I < 1.3. The combined result is a
formidable selection effect against post-starburst LSB dwarfs.
LSB disk galaxies also have blue colors. After excluding galaxies with significant bulges, McGaugh & Bothun (1994) found U - B = - 0.17, B - V = 0.49 ± 0.04, and V - I = 0.89, similar to the colors of an actively star-forming Sc galaxy. Romanishin, Strom, & Strom (1983) found averages of B - V = 0.43 ± 0.04 and V - R = 0.60 ± 0.02. This compares with B - V = 0.75 ± 0.03 and V - R = 0.53 for normal spirals that are on average 2 magnitudes brighter in µB (de Jong & van der Kruit 1994). For seven giant LSB disks, Sprayberry et al. (1995a) found B - V = 0.73 ± 0.05 and V - R = 0.50 ± 0.04. LSB galaxies in general are about 0.25 magnitudes bluer in B - V than HSB galaxies, and both populations show a correlation between increasing redness and larger scale length. This effect, plus the fact that there is no correlation between color and surface brightness, can be used to rule out fading as a cause of the low surface brightness for both LSB giants and dwarfs. The HII region oxygen abundances are also uncorrelated with color, which means that the blue colors are not caused by low metallicity. Metallicities are typically 1/3 solar (McGaugh 1994a).
Sprayberry et al (1995a)
found four Seyfert 1 nuclei and one Seyfert 2 nuclei
in a study of 10 LSB giants, as indicated by broad
H emission and
sometimes [NII] / H ratios
indicative of excitation by a power law (see also
Knezek 1993).
Although the sample is small, the Poisson probability of
drawing so many Seyferts from a population of normal galaxies with the same
luminosity
(Meurs & Wilson 1984)
is small, ~ 2 × 10⁻⁶. It is
possible that the kinematics of a low surface mass density disk can
facilitate mass transfer into the central parsec, where it can fuel
nuclear activity.
GAS CONTENT AND EVOLUTION Combining radio and optical data leads to a better understanding of the evolution of LSB galaxies. The HI properties of LSB galaxies as a class were first studied by Hawarden et al (1981). More recently, radio synthesis telescopes have been used to derive rotation curves and to map out the gas in the disk. LSB disks have low star formation rates, despite their normal HI contents and luminosities. Kennicutt (1989) has shown that the star formation rate in HSB disks has a threshold, below which widespread star formation does not occur. The critical HI surface mass density is
| (18) |
where is a
dimensionless constant around unity,
v
is the velocity dispersion in the gas disk, and the circular velocity of
the gas is V at radius R. Using HI synthesis data from the
Westerbork Telescope,
van der Hulst et al (1993)
have found that LSB disks have HI surface mass densities of 3-6
M
pc-2, a factor of two lower than HSB disks
(Cayette, Kotanyi, &
Balkowski 1993).
This puts most of the disk below the threshold for star formation,
given by
 crit = 0.059
v(V /
R) M
pc-2, where
v is in
kms-1, and where V is the rotation velocity in
kms-1 at a distance R in kpc.
crit = 0.059
v(V /
R) M
pc-2, where
v is in
kms-1, and where V is the rotation velocity in
kms-1 at a distance R in kpc.
The physical basis for this threshold is the onset of gravitational
instability in a thin, rotating disk
(Toomre 1964,
Quirk 1972).
Star formation is therefore governed by local physics; despite the low
overall rate, the star formation in isolated regions can be prodigious
(Impey & Bothun 1989).
A plausible hypothesis
is that the evolution of all galaxies is driven by surface mass
density. Since mass is roughly given by
M
vmax2h, and since both HSB and
LSB galaxies follow a Fisher-Tully relation,
L
vmax4, it follows that
(M / L)
vmax2h / (Mh)2
 ,
where is the mean
surface mass density
(de Blok, van der Hulst
& Bothun 1995).
Low surface mass density galaxies evolve slowly, forming few
stars, which results in low surface brightness and high values of
M / L.
,
where is the mean
surface mass density
(de Blok, van der Hulst
& Bothun 1995).
Low surface mass density galaxies evolve slowly, forming few
stars, which results in low surface brightness and high values of
M / L.
It is important to reiterate the facility with which quiescent and low mass
galaxies can escape detection by either optical or radio surveys. The
neutral disks of spiral galaxies are observed to truncate sharply below
a column density of 2-3 × 10¹⁹ atoms cm-3
(e.g.
van Gorkom et al 1997).
As the column density of HI falls off, galaxy disks can be ionized,
which rapidly reduces the detectable HI mass
(Maloney 1993,
Corbelli & Salpeter
1993,
Dove & Shull 1994).
As parametrized by
Dalcanton, Spergel, &
Summers (1997a),
the observable HI mass is
MHI = 50 HI
h2[1 - 0.01HI-1.43(5.61 + 1.43
ln)]
M, where
h is in units of kpc and
HI is in units of
1021 atoms
cm-2. This trend is illustrated in the left panel of
Figure 5. Galaxies
with scale lengths under 5 kpc or central surface HI densities under
1020 atoms cm-2 drop below the sensitivity limit
of a typical Arecibo survey.
Galaxies with scale lengths under 2 kpc or central surface HI densities
under 3 × 10¹⁹ atoms cm-2 are difficult to
detect in any HI survey.
HI
h2[1 - 0.01HI-1.43(5.61 + 1.43
ln)]
M, where
h is in units of kpc and
HI is in units of
1021 atoms
cm-2. This trend is illustrated in the left panel of
Figure 5. Galaxies
with scale lengths under 5 kpc or central surface HI densities under
1020 atoms cm-2 drop below the sensitivity limit
of a typical Arecibo survey.
Galaxies with scale lengths under 2 kpc or central surface HI densities
under 3 × 10¹⁹ atoms cm-2 are difficult to
detect in any HI survey.
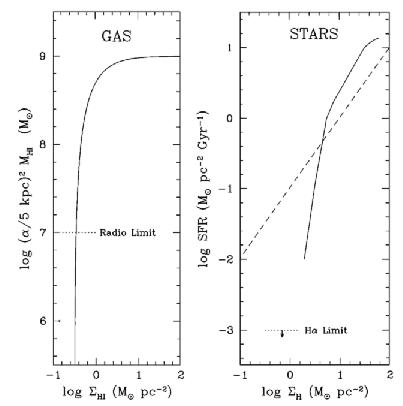
|
Figure 5. The left hand panel shows the detectivity of HI as a function of scale length and surface mass density of gas. (From Dalcanton, Spergel & Summers 1997a.) The right panel shos the dependence of disk star formation rate on the surface mass density of gas, HI plus H2. The dashed line corresponds to a constant star formation rate over a Hubble time. (From Kennicutt 1989.) |
There is a similarly rapid drop in the detectability of newly formed stars
as a function of the total (HI plus H2) hydrogen surface
density. Using
a conversion from H flux to
star formation rate from
Kennicutt (1983),
the dependence of H surface
brightness on total hydrogen surface density for Sc galaxies
(Kennicutt 1989)
can be parametrized in a quasi-Schechter form as
SFR = 2.72
exp(-5/H)(-5/H-0.78)
M
pc-2 Gyr-1, where
H is in units of
M
pc-2. Note that this is
only a rough scaling, as the threshold surface densities range from 2-10
M
pc-2, and the H
surface brightness at a given hydrogen
surface density ranges over more than a factor of ten. The right panel
of Figure 5 shows this dependence, where the
dashed line represents a steady star formation
rate over a Hubble time. Below a few
M
pc-2, the star formation rate
drops so low that H emission
is not detectable, and the rate of gas
consumption is so low that the galaxy is essentially quiescent.
4.3. Implications for Quasar Absorption
The narrow absorption lines seen in the spectra of quasars are powerful
probes of dim and low column density material along the line of
sight. The neutral hydrogen column densities of the absorbers range over
ten orders of magnitude, 1012 < nHI <
1022 cm-2. The high column density or
"damped" Lyman- systems have
associated metals, and may be the
progenitors of normal spiral galaxies. The low column density systems of the
Lyman- "forest" have much
lower metallicity, and are only weakly
associated with galaxies. Intermediate HI column densities are probed by the
CIV  1548,1550 and MgII
2797,2803 absorption
doublets, which are strongly clustered in velocity space, and are presumed
to originate in the halos of normal galaxies, which are sometimes
located in clusters. For a recent review, see the proceedings edited by
Meylan (1995).
1548,1550 and MgII
2797,2803 absorption
doublets, which are strongly clustered in velocity space, and are presumed
to originate in the halos of normal galaxies, which are sometimes
located in clusters. For a recent review, see the proceedings edited by
Meylan (1995).
The number of absorbers per unit redshift down to a particular rest equivalent width line is given by
| (19) |
where
g(L) is the
conventional Schechter function
multiplied by fg, the fraction of gas-rich galaxies,
basically spirals
and irregulars. We assume no evolution in the redshift path density, i.e.
= 1, which is appropriate
for both the MgII absorbers
(Steidel & Sargent
1992),
and for the low column density
Lyman- absorbers at low
redshift
(Bahcall et al 1993).
It is also likely to be appropriate for the high column density,
damped Lyman- absorbers
(Lanzetta et al. 1991,
but see
Rao, Turnshek & Briggs
1995).
The cross sectional area of the absorbers is
A(L / L*) = (
R*2/2)(L /
L*)2
2,
where R* is a fiducial radius,
typically the Holmberg radius for an L* galaxy, and
is a factor
that relates the optical size of a galaxy to the HI size at the column
density of interest. This yields
| (20) |
The absorption path length depends on the galaxy luminosity, the faint
end slope of the luminosity function, and the relationship between
absorption cross-section and
luminosity. Assuming no evolution of the galaxy luminosity function (either
*
or ) over the path length,
the integral over redshift gives the fraction of
the absorption path length that is caused by galaxies brighter than a
certain luminosity. The conventional
Holmberg (1975)
relation is (R / R*)
(L /
L*)0.4. Using this scaling and the conventional
= - 1, dwarfs with
MB > - 16
should contribute ~ 10% of the absorption cross section.
METAL LINE ABSORBERS
MgII absorbers are equivalent to absorbers selected to be optically
thick in the Lyman continuum,
 (912 Å) > 1 or
NHI > 3 × 10¹⁷ atoms
cm-2
(Sargent, Boksenberg &
Steidel 1988).
There is strong statistical evidence linking MgII absorption to the
presence of a bright galaxy near the line of sight
(Bergeron & Boisse 1991,
Steidel & Dickinson
1992).
The traditional Holmberg scaling is almost certainly not appropriate.
Impey, Bothun, & Malin
(1988)
showed that for a Virgo sample of galaxies all at roughly the same
distance, the relation
R
L0.4 is partly a consequence of selection
effects caused by sky brightness.
Steidel (1993)
studied the impact parameters of
galaxies causing 56 MgII absorptions over the range
0.2 < z < 2.2. The results were inconsistent with
= 0.4, and had a maximum
liklihood fit of = 0.2 and
R * = 35h100-1
kpc. The scaling R
L0.2 with
= - 1 implies that dwarfs
contribute ~ 75% of the absorption cross section.
Alternatively, we can adopt
= 0.4, and consider the
effect of a steep faint
end slope to the luminosity function. Dwarfs contribute 35% of the cross
section if = 0.4 and
= - 1.4, and 85% of the
cross section if = 0.4 and
= - 1.7. The integral
(912 Å) > 1 or
NHI > 3 × 10¹⁷ atoms
cm-2
(Sargent, Boksenberg &
Steidel 1988).
There is strong statistical evidence linking MgII absorption to the
presence of a bright galaxy near the line of sight
(Bergeron & Boisse 1991,
Steidel & Dickinson
1992).
The traditional Holmberg scaling is almost certainly not appropriate.
Impey, Bothun, & Malin
(1988)
showed that for a Virgo sample of galaxies all at roughly the same
distance, the relation
R
L0.4 is partly a consequence of selection
effects caused by sky brightness.
Steidel (1993)
studied the impact parameters of
galaxies causing 56 MgII absorptions over the range
0.2 < z < 2.2. The results were inconsistent with
= 0.4, and had a maximum
liklihood fit of = 0.2 and
R * = 35h100-1
kpc. The scaling R
L0.2 with
= - 1 implies that dwarfs
contribute ~ 75% of the absorption cross section.
Alternatively, we can adopt
= 0.4, and consider the
effect of a steep faint
end slope to the luminosity function. Dwarfs contribute 35% of the cross
section if = 0.4 and
= - 1.4, and 85% of the
cross section if = 0.4 and
= - 1.7. The integral
 (L)A(L)
dL diverges and dwarfs dominate the cross section for any
combination +
2
(L)A(L)
dL diverges and dwarfs dominate the cross section for any
combination +
2
 - 1.
- 1.
Equation (20) uses local galaxy properties to predict the demographics
of the quasar absorbers. This can be compared with the observed
properties of individual
absorbers, which are detected as galaxies with the appropriate redshift
lying at small impact parameters from the quasar sightline.
Steidel (1993)
found no absorbers with MB > - 19.4 + 5
logh100, as opposed to 80% predicted if
= 0.2, and 50% predicted if
= - 1.4. This sharp
difference implies that copious gas-rich dwarfs
(York et al 1986,
Tyson & Scalo 1988)
or unseen low surface brightness galaxies
(Phillipps, Disney &
Davies 1993)
cannot be a major contributor to Mg II absorption. We also consider it
unlikely that fg declines with decreasing luminosity;
a number of field galaxy
luminosity functions have a rising tail of primarily gas-rich
dwarfs. However, the gas in low mass galaxies is probably ionized, so
that dwarfs are not responsible for HI absorption in the range
3 × 10¹⁷ < NHI < 3 ×
1019 atoms cm-2.
Maloney (1993)
has shown that the column density Ncrit below
which gas is ionized, and therefore galaxies are mostly invisible in the
21 cm line, is a function of halo surface mass density,
Ncrit
halo0.6.
Low mass or low surface mass density galaxies will therefore be
ionized at larger total gas column densities.
HIGH COLUMN DENSITY HYDROGEN ABSORBERS
The most massive gas disks produce damped
Lyman- absorption with HI
columns in the range 2 × 10²⁰ < NHI
< 6 × 10²² atoms
cm-2. At a mean redshift of z = 2.5, the absorbers have
dN/dz 0.2
and contribute = 1.45
× 10-3 h100-1
(q0 = 0.5) to the mass density of the universe
(Lanzetta et al 1991).
Impey & Bothun (1989)
made the point that gas-rich LSB disks have many similar properties to
the progenitors of spiral galaxies seen at high redshift, including size, HI
column density, and a low mean star formation rate.
Bergeron (1995)
has directly observed LSB galaxy counterparts to damped
Lyman- absorbers
at intermediate redshift.
For the large LSB disks, the observational bounds are
2.8 × 10⁻⁵ < dN / dz < 1.9 ×
10-2. The upper bound comes from the diameter,
140h100-1 kpc at the
3 × 10¹⁹ atoms cm-2 contour, and the limit on
the space density of less than
4.1 × 10⁻⁴ Mpc-3 for objects like Malin 1. The
much less restrictive lower bound comes from the minimum space density
of galaxies
in the tail of the size distribution of UGC galaxies, those with
diameter greater than 50 kpc.
Rao & Briggs (1993)
derived dN/dz = 0.015 ± 0.004 for the gas
cross section of normal galaxies at the present epoch, so it is possible
than giant
disks like Malin 1 are the largest contributor to high column
density HI absorption. The upper bound on the incidence of damped
Lyman- systems at low redshift
is dN/dz < 0.05
(Storrie-Lombardi et al
1994).
The contribution of damped
Lyman- systems to the
density parameter at z ~ 0 is found to be
= 1.9 ×
10-4
(Lanzetta, Wolfe, &
Turnshek 1995).
This can
be compared to the bounds from the gas and stars in giant LSB galaxies:
gas =
gas /
crit
< 1.5 × 10⁻⁴, where
crit
= 2.78 × 10¹¹ h1002
M
Mpc-3, and an HI mass of 1011
M is adopted
for Malin 1, and
stars =
stars /
crit
> 1.1 × 10⁻⁴(M / L), where we
use the luminosity density of LSB galaxies,
3 ± 0.5 × 10⁷h100
L
Mpc-3. Therefore, large gas disks can be a substantial
contributor to the local population of damped
Lyman- absorbers.
LOW COLUMN DENSITY HYDROGEN ABSORBERS
The last comparison concerns the low HI column density absorbers of the
Lyman- forest, which have
dN/dz 100 for
NHI > 1013 atoms cm-2
(Morris et al 1991),
and dN/dz
15 for NHI > 1014 atoms cm-2
(Bahcall et al 1993).
Tyson (1988b)
speculated that the copious low column density absorbers were associated
with gas-rich dwarf galaxies. The space density of the absorbers is
= 2.9 ×
10-2 Mpc-3, where we adopt the large
characteristic absorber size of 500h100-1
kpc at z ~ 0.7, measured by
Dinshaw et al (1995)
using common absorption in a quasar pair to define a size. The maximum
liklihood technique yields a 95% confidence interval which translates to
Ly = 0.3-3.7
× 10-2 Mpc-3. This overlaps with the
observational range of the number density of low luminosity galaxies
Ngal = 1.1-6.3
× 10-2 Mpc-3, which makes use of the
density of MB = - 14 galaxies from
Loveday et al (1992)
as a lower bound, and using the surface brightness corrected density of
MB < - 14 galaxies from the APM LSB survey as an
upper bound.
LSB galaxies share the space density and clustering properties of
Lyman-
absorbers seen at somewhat higher redshifts.
Rauch & Haehnelt
(1995)
showed that for uniform clouds of thickness D and temperature
T in a UV ionizing background I (in units of
10-21 erg Hz-1 sr-1 s-1
cm-2),
baryon
0.027h100-1 (T/3 ×
104 K)1/3 I1/2
(D/100 kpc)1/2. If the clouds are large and
elongated, most baryons may be in this form. Direct association of low
redshift absorbers with
LSB galaxies is unlikely; it has been ruled out in some cases
(Rauch, Weymann & Morris
1996).
On the other hand, the association of the absorbers with bright
galaxies is difficult to prove; all that the observations provide is an
impact
parameter, and there may be undetected galaxies closer to the line of sight.
Large samples are required before the kinematics and peculiar velocities
of the absorbers can be compared with similar information for the
galaxies along the line
of sight. Simulations which incorporate gas dynamics have shed some
light on the situation. The low column density HI absorbers form a
filamentary network that traces
out the dark matter potential of large scale structure
(Cen et al 1994,
Petitjean, Mucket &
Kates 1995,
Hernquist et al 1996).
The copious number of observed
LSB dwarfs might be associated with collapsed regions within a more
extensive network of diffuse hydrogen.
LSB GALAXIES AT COSMOLOGICAL DISTANCES The discussion so far has concentrated on the properties of LSB galaxies in the local universe. However, these unassuming stellar systems have great relevance for surveys of galaxies at cosmological distances and significant lookback times.
The visibility of galaxies is defined by the isophotal limits of the survey, but it is also a strong function of galaxy redshift and type. As first discussed by Phillipps, Davies & Disney (1990), galaxies in deep surveys are more likely to be blue and of high surface brightness, since those types have a large accesible volume. The cosmological corrections give

| (21) |
and

| (21) |
where k(z) are the k-corrections. As we consider galaxies
at higher and higher redshifts, the visibility is reduced by a
combination of k-corrections
and the Tolman (1 + z)4 cosmological dimming of the
surface brightness
(Phillipps, Davies &
Disney 1990).
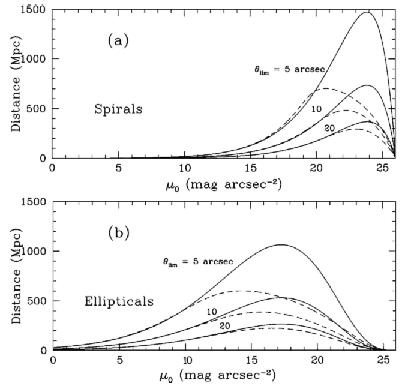
Figure 6 shows the visibility distance for
spirals (panel a) and ellipticals (panel b), assuming an angular
diameter limited survey with three different values of
 lim plotted. The
dashed curves show the selection
functions with cosmological effects (k-corrections, Tolman surface
brightness dimming)
included. The peak visibility of ellipticals at zero redshift is 30%
smaller than that of spirals, and ellipticals have larger
k-corrections. The result is that
ellipticals are much less visible than spirals in deep optical surveys.
lim plotted. The
dashed curves show the selection
functions with cosmological effects (k-corrections, Tolman surface
brightness dimming)
included. The peak visibility of ellipticals at zero redshift is 30%
smaller than that of spirals, and ellipticals have larger
k-corrections. The result is that
ellipticals are much less visible than spirals in deep optical surveys.
|
Figure 6. (a) The visibility distance for spirals assuming three different values of the angular size limit in arcseconds. The dashed curves show the effect of cosmological corrections to the visibility distance. (b) As above, for elliptical galaxies. In both cases, MB = - 21 has been assumed, the curves for other cases scale with the luminosity distance. (From Phillipps, Davies & Disney 1990.) |
The isophotal limits of the pencil beam CCD surveys are so deep that
those surveys are sensitive to galaxies that are absent from local, wide
field surveys. The
curves superimposed on Figure 2
illustrate this important point (see also
McGaugh 1994b).
The far left solid curve shows the selection function of the APM LSB
survey
(Sprayberry, Impey &
Irwin 1996),
assuming µlim = 26 B mag
arcsec-2 and
lim = 10
arcsec. The two curves to the right show the equivalent
selection function at z = 0.1 and z = 0.5. Only the most
luminous and high
surface brightness galaxies at z = 0.5 are detected on Schmidt
photographic plates. Whereas about 30% of RC3 galaxies fit this
criterion, only about 10% of the APM sample do. The dashed curve shows
the selection function at z = 0.5 for the deep CCD survey of
Lilly (1993),
with limits of µlim = 28.6 B
mag arcsec-2 and
lim = 2
arcsec. The CCD survey encompasses a larger region
of (µ,L) space at z = 0.5 than the APM survey
does in the local universe.
In other words, deep CCD surveys are sensitive to a potentially large
number of galaxies (not neccesarily dwarfs) that are essentially absent
from published wide field surveys.
RELATION TO DEEP GALAXY SURVEYS The number of faint galaxies in the B and I bands exceeds the expectations of all cosmological models that do not include evolution (Tyson & Jarvis 1979, Kron 1982, Tyson 1988a, Lilly, Cowie & Gardner 1991). The excess of blue galaxies must however be reconciled with the observed redshift distribution at B = 24, which is consistent with a no evolution prediction. Many of the solutions that have been proposed so far are problematical. The excess population at z = 0.3-0.5 cannot be removed by merging because the faint blue galaxies are not strongly enough clustered (Efstathiou et al 1991), and the requisite merger remnants cannot be found (Dalcanton 1993). Selective luminosity evolution has also been proposed, where a high space density of bright dwarfs evolves strongly to become a common but faint population locally (Broadhurst, Ellis & Shanks 1988, Lilly 1993). This rapid and strong evolution has not been observed to occur. The distasteful option of a cosmological constant has probably been ruled out by the statistics of gravitational lensing (Fukagita & Turner 1991). More conservative solutions involve adjustments of the local luminosity functions of the different galaxy types (Koo, Gronwall & Bruzual 1993). For an extensive discussion, see the article by Ellis in this volume.
McGaugh (1994b) has shown that LSB disks with µ0 ~ 23.5 mag arcsec-2 and s ~ 3 kpc can be readily detected by ultra-deep surveys out to z ~ 0.8, because the high sensitivity of CCD surveys more than compensates for cosmological dimming and k-corrections. However, a disk galaxy with the properties just described will only be detectable in the wide area survey of Loveday et al (1992) out to z = 0.02, with only one third of the flux is detected above the limiting isophote. Both the numbers and fluxes of LSB galaxies are underestimated by large area photographic surveys. To summarize, the optimum surface brightness for galaxy detection moves to higher intrinsic surface brightness with redshift, to counteract the effects of k-corrections and cosmological dimming. These distance-dependent selections effects can mimic evolutionary changes in the galaxy population and distort the observed luminosity function at high redshift.
Sprayberry et al (1997)
carried out a morphological separation of the LSB galaxies
with redshifts from the APM survey, of which ~ 50% are spirals and ~
40% of which are irregulars (the remainder have peculiar
morphologies). Most of the rise in the numbers fainter than
MB = - 16 is accounted for by
irregulars. This joins a growing list of studies that find gas-rich
irregulars to be a steeply rising component of the field galaxy luminosity
function. Although the statistics are poor,
Marzke et al (1994b)
found a faint end slope of
= - 1.87 for the irregular
Sm-Im types.
Schade & Ferguson
(1994)
deduced = - 1.63 for low
luminosity star-forming galaxies, based on a reinterpretation of
the survey of Salzer
(1989,
see also
Boroson, Salzer &
Trotter 1993).
Driver et al (1994b)
have suggested a dwarf-rich model to explain deep BVRI galaxy counts.
The model with
= - 1.8 for the dwarfs can
be used to fit the B band
counts down to B = 27.5, but such a model predicts lower
redshifts than are observed by spectroscopy down to B = 24
(Cowie, Songaila, & Hu
1991).
More recently,
Driver et al (1995a)
have measured the morphologies of galaxies from
a single ultradeep WFPC2 image. At a depth corresponding to
B 26, half
the galaxies are late-type spirals or irregulars, and find that some
combination of rapid evolution and a steep faint end slope for the local
dwarf luminosity function is required to account for the data.
The local low luminosity LSB population can be compared with the faint blue galaxies in the Medium Deep Survey (MDS) of Driver, Windhorst & Griffiths (1995b), which are taken to be at a typical redshift of z ~ 0.3. LSB field galaxies with MB > - 16, are at typical distances of 10 < d < 40h100-1 Mpc. They have central surface brightnesses in the range 22 < µ < 25 B mag arcsec-2 , and effective angular radii of 6 < reff < 20 arcseconds (Impey et al 1996). If they are related to the LSB dwarfs in clusters, they will have B - V ~ 0.5 (Impey, Bothun & Malin 1988). The late-type and irregular (Sdm/Irr) MDS galaxies have median effective radii of 0.4 arcseconds (Im et al 1995a), which would scale to 20 arcseconds for a local population. The central surface brightnesses of the MDS sample convert into a range 23 < µ < 24 B mag arcsec-2 locally, assuming no evolution. The Sdm/Irr MDS galaxies have colors V - I ~ 1, also consistent with a local color of B - V ~ 0.5, again assuming no evolution. In addition, Dalcanton & Schectman (1996) showed that the faint blue "chain" galaxies found by Cowie, Hu & Songaila (1995b) can be plausibly related to edge-on LSB disk galaxies. Both the faint blue galaxies (Efstathiou et al 1991) and the local LSB galaxies (Mo et al 1994) are weakly clustered.
While it can be shown that local LSB galaxies have similar properties to many of the faint blue galaxies, it is not clear that the high and low redshift populations can be related with a consistent evolutionary scheme. All such comparisons must take account of the change in morphology with luminosity at any redshift, from luminous E/S0/Sp types down to dwarf E/S0/Im types. Detailed modelling is hampered by the factor of two disagreement between the normalizations of the deep survey luminosity functions (Ellis et al 1996, Cowie et al 1996), probably caused by large scale structure along the pencil-beam surveys. Generally speaking, deep redshift surveys point to two populations at z ~ 0.5: red galaxies that evolve very little, and a rapidly evolving (and presumably fading) blue population (Lilly et al 1996, Ellis et al 1996).
Ferguson & McGaugh (1995) have demonstrated that LSB galaxies could be a substantial contributor to the faint galaxy counts. They considered two rather extreme populations in the (µ, L) plane: galaxies with L and µ uncorrelated, and galaxies with a tight correlation between L and µ. Redshifts for the APM sample (Impey et al 1996) indicate that the truth lies between these two situations (see Figure 2). Babul & Ferguson (1996) have used plausible evolutionary models to make detailed predictions of faint blue galaxies that fade and redden, based on the earlier model of Babul & Rees (1992). There are a number of difficulties in identifying local LSB galaxies as the faded remnants of the faint blue galaxy population. If faded red galaxies are present in sufficient profusion, they should appear in the low redshift bins of the deep redshift surveys (Lilly et al 1995, Bouwens & Silk 1996), and they should contribute to the deep counts around B = 26 (Driver & Phillipps 1996). In addition, the nearby LSB population is too blue to fit a fading scenario, and the disks appear to be evolving slowly not rapidly (McGaugh 1994a, Ferguson & McGaugh 1995). Fading scenarios usually invoke supernova-driven gas ejection during a burst of star formation, in conflict with the large gas content of the local sample. The existing uncertainty strongly motivates new searches for dim and diffuse galaxies.
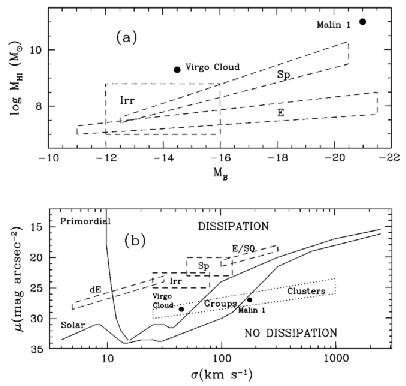
FORMATION OF LSB GALAXIES Finally, LSB galaxies can be placed in the context of galaxy formation and evolution in the broadest sense. Figure 7a shows a schematic version of the bivariate luminosity function of galaxies in stars (measured by luminosity and surface brightness for E galaxies) and gas (measured by the 21-cm line for Sp galaxies). The selection effects against finding extreme LSB galaxies like Malin 1 and the Virgo cloud (Giovanelli & Haynes 1989) are formidable. Since starbursting dwarfs do not have the gas supply to sustain their star formation for long, we might wonder how to detect the larger number of quiescent dwarfs. Our understanding of what drives the star formation history and visibility of galaxies, through the conversion of MHI into MB, is still very incomplete.
|
Figure 7. (a) Schematic plot of stellar luminosity against gas mass for different galaxy types. LSB galaxies of various types lie not far off the relationship defined by most galaxies. (From Giovanelli & Haynes 1989, Bothun et al 1987.) (b) Plot of surface brightness in the B band or surface mass density against velocity dispersion for various cosmic structures, assuming dissipation from intercloud collisions. The giant LSB disk galaxies have the dynamical properties of groups of galaxies. (From Efstathiou & Silk 1983, see also Burstein et al 1995.) |
It appears that the formation of large numbers of LSB galaxies is an
unavoidable consequence of heirarchical schemes for the formation of
large scale structure. In the standard picture of the spherical collapse
of a top-hat density perturbation
(Gunn & Gott 1972),
smaller perturbations reach their maximum extents more slowly,
and collapse at later times. Assuming Gaussian fluctuations, small
amplitude peaks will be found preferentially in under-dense regions,
such that galaxies that result
from small amplitude peaks are less correlated than galaxies that
collapse earlier from large amplitude peaks
(Kaiser 1984).
It is natural to associate dwarf galaxies
with the 1-2 peaks
(Dekel & Silk 1986).
Mo, McGaugh & Bothun
(1994)
showed that the clustering properties of LSB galaxies were consistent
with late formation. The giant, gas-rich galaxies like Malin 1 are more
likely to originate
from rare, 3 peaks in
under-dense regions, since the gas disks are
vulnerable to interactions in over-dense regions
(Hoffman, Silk & Wyse
1992).
In their application of the formalism of
Press & Schechter
(1974),
Dalcanton, Spergel &
Summers (1997a)
find that the mean baryonic surface mass density
Fr*
 3()(
3()( /
)3
in the case = 1. The mean
surface density is defined with a region
of size r*, which has a collpase factor
(), where
is the dimensionless spin parameter. The timescale of violent relaxation and
virialization is vir
[( /
) + 1], and the
virialized radius is Rvir = Rinit(1
+ z)-1(1 + 178
-0.6)-1/3. Furthermore, the amplitude
of the correlation function traced by galaxies is
3()
/
)3
in the case = 1. The mean
surface density is defined with a region
of size r*, which has a collpase factor
(), where
is the dimensionless spin parameter. The timescale of violent relaxation and
virialization is vir
[( /
) + 1], and the
virialized radius is Rvir = Rinit(1
+ z)-1(1 + 178
-0.6)-1/3. Furthermore, the amplitude
of the correlation function traced by galaxies is
3()
 (r)3/2, so that the correlation amplitude
of galaxies only falls as a weak function of surface mass density. This
is consistent with the clustering amplitude
of LSB galaxies measured by
Mo, McGaugh & Bothun
(1994).
The total mass density of
LSB galaxies in heirarchical clustering schemes can exceed the mass
density of normal, high surface brightness galaxies.
(r)3/2, so that the correlation amplitude
of galaxies only falls as a weak function of surface mass density. This
is consistent with the clustering amplitude
of LSB galaxies measured by
Mo, McGaugh & Bothun
(1994).
The total mass density of
LSB galaxies in heirarchical clustering schemes can exceed the mass
density of normal, high surface brightness galaxies.
Figure 7b shows the role that dissipation plays in structure formation in the universe (e.g. Efstathiou & Silk 1983). In this plot of surface brightness (or equivalently, surface mass density) versus velocity dispersion, the solid lines show the demarcation between structures that have undergone dissipation and those that have not. This simple model assumes that star formation occurs by radiative shocks in intercloud collisions. If either the surface mass density is too low or the velocity dispersion is too high, the cooling is inefficient and so there is no compression and no subsequent star formation. The stellar velocity dispersion is therefore a fossilized measure of the cloud velocity dispersion at the epoch when most of the dissipation (and star formation) occurred.
In heirarchical clustering, the relationship between surface mass
density and velocity dispersion for non-dissipative structures is
-4(n+2)/(1-n),
where n is the spectral index of the initial fluctuations
(Efstathiou & Silk
1983).
Clustering goes towards increasing
if n < 1,
and towards increasing
if n > -
2. The eventual goal is to understand
LSB systems well enough to interpret them in terms of an "HR" diagram for
galaxies, a goal that is being approached for dynamically hot systems
(Bender, Burstein, &
Faber 1993).
This goal is plausible as long as the structure of the dissipative
baryonic matter is directly related to the structure of the dark halo
(Faber 1982).
Figure 7a illustrates that extreme LSB galaxies
like Malin 1 and the Virgo
cloud have similar properties to small groups or clusters of galaxies
(Burstein et al 1995).
They are displaced by a factor of 100 in surface mass density from
the conventional galaxies of the Hubble sequence. This suggests an alternate
evolutionary history that involves late collapse and dissipation, slow
evolution, and a low density cosmic environment.
LSB galaxies play a key role in this cosmogony. Navarro, Frenk & White (1996) argue that dark matter halos which formed through dissipationless heirarchical clustering have a universal mass profile. Each halo mass is specified solely by its characteristic overdensity, which depends on the mean density at the epoch of collapse. HSB galaxies have fast-rising rotation curves which flatten off to outer regions of dark matter domination. LSB disks have slowly rising rotation curves that are dark matter dominated at almost all radii. Pickering et al (1997) show examples that can be traced out to ~ 100 h100-1 kpc. In general, LSB galaxies have high angular momentum disks, with larger scale lengths at the same circular velocity (Zwaan et al 1995). Dalcanton, Spergel & Summers (1997a) describe the evolution of high angular momentum, low surface mass density disks, and provide a context for understanding the broad relationship between luminosity and surface brightness, and for understanding the properties of the local luminosity function. Moreover, the Cold Dark Matter model predicts far too many dark halos to match the cataloged galaxy population (White & Frenk 1991). Many dark halos may have failed to form galaxies, or may have formed galaxies that have so far escaped detection. Observational limitations and theoretical expectations align to point to the importance of LSB galaxies.
ACKNOWLEDGMENTS
We acknowledge inspiration and provocation from our former students, Stacy McGaugh and David Sprayberry, our current students, Tim Pickering and Karen O'Neil, and our longtime collaborators, Jim Schombert and David Malin. A number of colleagues contributed greatly to the results and ideas described in this review - Bruno Binggeli, Frank Briggs, Julianne Dalcanton, Simon Driver, Harry Ferguson, Mike Irwin, Pat Knezek, Ron Marzke, Allan Sandage, and Steve Schneider. We are grateful to the Welsh "dragons," Mike Disney, Steve Phillipps, and Jon Davies, for breathing life and fire into this subject over a number of years. Allan Sandage is thanked for his many detailed and thoughtful comments on the manuscript. We acknowledge support from the NSF under grant AST-9003158.