


The central region of the galaxy, within a few hundred parsec from the
nucleus, is very complex. The nucleus itself, hidden behind thick dust
clouds, is visible at infrared (Sect. 5.3),
(sub)millimetre and centimetre
wavelengths (Sect. 5.4) and again at high energies
(Sect. 5.5), but generally
requires very high resolutions to separate it from its surroundings.
At centimetre wavelengths
and at high energies, confusion is caused by the emission from the inner
jet and even more so from the milliarcsec nuclear jets
(Meier et al. 1989;
Jones et al. 1996;
Tingay et al. 1998).
With increasing observing frequency, the steep nonthermal spectrum of the
jet features reduces them to insignificance, so that shortwards of 1 cm
( 30 GHz) only the nucleus
shines brightly.
30 GHz) only the nucleus
shines brightly.
Infrared and millimetre observations have established the presence of a
compact circumnuclear disk
(Israel et al. 1990,
1991;
Rydbeck et al. 1993;
Hawarden et al. 1993;
Sect. 5.2). At wavelengths shorter than 1 mm
( 300 GHz),
thermal emission from this compact circumnuclear disk becomes a new and
important source of confusion
(Cunningham et al. 1984;
Hawarden et al. 1993).
Although at the wavelengths and resolutions at which the nucleus itself
can be seen, absolute flux-density determinations suffer from various
calibration problems, it is clear that it is strongly time-variable
(Sect. 5.6).
The highly collimated nuclear radiojets likewise vary their structure and
intensity with time
(Jauncey et al. 1995;
Tingay et al. 1998).
Analyzing CO measurements and infrared data from the literature,
Israel et al. (1990;
1991)
discovered a circumnuclear disk at the core
of NGC 5128, with an estimated gas mass 10
7 M![]() . Its outer radius
is 110-280 pc and it contains a central region of radius 40 pc, devoid of
CO. Such a 100 pc-scale disk appears to be a common feature of active
galaxies (cf.
Maiolino & Rieke
1995).
The CO gas in the disk has excitation temperatures of the order of 25 K and
is significantly warmer than the CO gas in the dust band
(Tex =
10-15 K (Sect. 4.2). The kinematic
signature of this rapidly rotating
circumnuclear disk is evident in central CO profiles
(Israel et al. 1991),
as well as in major-axis position-velocity diagrams (cf. Fig. 2
of
Quillen et al. 1992).
The total dynamical mass within the disk area is estimated at
about 109 M
. Its outer radius
is 110-280 pc and it contains a central region of radius 40 pc, devoid of
CO. Such a 100 pc-scale disk appears to be a common feature of active
galaxies (cf.
Maiolino & Rieke
1995).
The CO gas in the disk has excitation temperatures of the order of 25 K and
is significantly warmer than the CO gas in the dust band
(Tex =
10-15 K (Sect. 4.2). The kinematic
signature of this rapidly rotating
circumnuclear disk is evident in central CO profiles
(Israel et al. 1991),
as well as in major-axis position-velocity diagrams (cf. Fig. 2
of
Quillen et al. 1992).
The total dynamical mass within the disk area is estimated at
about 109 M![]() , i.e. a hundred times higher than the
molecular gas mass
(Israel et al. 1991;
Rydbeck et al. 1993).
Emission from other molecular species in the circumnuclear disk,
such as HCO+, HCN, HNC and probably also
C3H2, HNCO and H2CO, has also been
detected
(Israel 1992).
, i.e. a hundred times higher than the
molecular gas mass
(Israel et al. 1991;
Rydbeck et al. 1993).
Emission from other molecular species in the circumnuclear disk,
such as HCO+, HCN, HNC and probably also
C3H2, HNCO and H2CO, has also been
detected
(Israel 1992).
Although the disk may have been revealed by its near-infrared extinction (Meadows & Allen 1992), it is the observations at 450µ and 800µm by Hawarden et al. (1993) that provided its first direct image. Its major axis is at position angle 140° - 145° (Hawarden et al. 1993; Rydbeck et al. 1993), quite different from that of the dust band, but perpendicular to the position angle of the jets (Sects. 2.4 and 5.4). The unresolved source seen in limited-resolution far-infrared (Joy et al. 1988) and mid-infared observations (Fig. 9) is due to thermal emission from this disk, as the flat-spectrum nonthermal nucleus is expected to contribute no more than about 25%-30% to the total observed emission at 100µm.
The disk appears to be larger in the J=1-0 transition than in the J = 2-1 transition (cf. Rydbeck et al. 1993). At submillimetre wavelengths it is larger again than in CO or at 100µm continuum. This suggests a temperature gradient across the disk, in addition to the density gradient postulated by Israel et al. (1990). Such a temperature gradient is to be expected if the excitation of the circumnuclear disk is caused primarily by winds and high-energy radiation from the power-law nucleus impinging on the cavity walls. The very red near-infrared colours, with their implicit suggestion of elevated dust temperatures in the inner region (Sect. 5.3) in addition to high extinction, as well as the compactness of [FeII] and H2 emission from the centre (Israel et al. 1990; Meadows & Allen 1992) support this picture. Such near-infrared line emission is commonly interpreted as evidence either for shocks or for strong X-ray/UV irradiation, also required by X-ray observations (Feigelson et al. 1981; Turner et al. 1997; see Sect. 5.5). Mouri (1994) has suggested that the H2 emission, with a temperature of about 1000 K, is excited by UV radiation from the nucleus, implying local densities in excess of 10 5 cm3 (Sternberg & Dalgarno 1989). This is supported by the detection of X-ray line emission and absorption indicating the presence of variably ionized absorbing clouds vigorously interacting with the nuclear continuum radiation (Morini et al. 1989; Sugizaki et al. 1997; Turner et al. 1997).
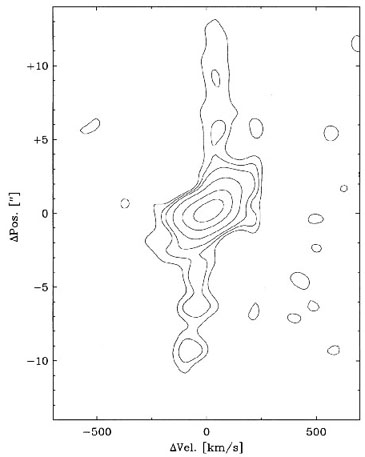
Unpublished observations by P. van der Werf (private communication) show
the outer radius of hot, vibrationally excited H2 emission to
be about 40 pc where it is rotating with 215
km s-1 (Fig. 10).
This implies
a dynamical mass of 4.4 × 10⁸
M![]() within 40 pc, or an almost
twentifold increase of mass per unit volume going from R = 150 pc
to R = 40 pc. Assuming the outer limit of the extent of excited
H2 emission to mark the cavity radius
(Koornneef & Israel
1996),
it is doubtful whether the nucleus of
NGC 5128 is powerful enough to provide the required
excitation by radiation alone
(Israel et al. 1990).
Unless disk material extends much further inwards,
it cannot control the collimation of the nuclear jets either,
because this occurs on significantly smaller scales (see
Clarke et al. 1992;
Jones et al. 1996).
Whether or not there is another, much smaller
and thinner accretion disk of the sort proposed by e.g.
Krolik & Lepp (1989),
it should be emphasized that the agent collimating
the jets must be closely, if possibly indirectly, connected with the
circumnuclear disk discussed here in order to explain the excellent
alignment between its rotation axis and the observed jet flow.
within 40 pc, or an almost
twentifold increase of mass per unit volume going from R = 150 pc
to R = 40 pc. Assuming the outer limit of the extent of excited
H2 emission to mark the cavity radius
(Koornneef & Israel
1996),
it is doubtful whether the nucleus of
NGC 5128 is powerful enough to provide the required
excitation by radiation alone
(Israel et al. 1990).
Unless disk material extends much further inwards,
it cannot control the collimation of the nuclear jets either,
because this occurs on significantly smaller scales (see
Clarke et al. 1992;
Jones et al. 1996).
Whether or not there is another, much smaller
and thinner accretion disk of the sort proposed by e.g.
Krolik & Lepp (1989),
it should be emphasized that the agent collimating
the jets must be closely, if possibly indirectly, connected with the
circumnuclear disk discussed here in order to explain the excellent
alignment between its rotation axis and the observed jet flow.
|
Figure 10. Velocity-position map of the distribution of excited molecular hydrogen at the inner edge of the circumnuclear disk. The bright central source indicates rapid rotation close to the nucleus. Courtesy P. van der Werf, University of Leiden. |
5.3. Nuclear emission at infrared wavelengths
Optically, the core of NGC 5128 is completely obscured. Because dust
extinction in the near-infrared is much less than at optical wavelengths
(e.g. AK ![]() 0.09AV), the core has been frequently
observed
(Becklin et al. 1971;
Kunkel & Bradt 1971;
Grasdalen & Joyce
1976;
Lépine, Braz &
Epchtein 1984)
as well as mapped
(Harding, Jones &
Rodgers 1981;
Quillen, Graham &
Frogel 1993;
Adams, Adamson & Giles
1983;
Giles 1986;
Joy et al. 1991;
Meadows & Allen 1992;
Turner et al. 1992;
Golombek, quoted in
Schreier et al. 1996)
in the 1-5µm
wavelength range. Near-infrared images longwards of 2µm,
usually show
a compact source close to the central position, but it is questionable
whether this represents direct emission from the nucleus (see e.g.
Antonucci & Barvainas
1990).
0.09AV), the core has been frequently
observed
(Becklin et al. 1971;
Kunkel & Bradt 1971;
Grasdalen & Joyce
1976;
Lépine, Braz &
Epchtein 1984)
as well as mapped
(Harding, Jones &
Rodgers 1981;
Quillen, Graham &
Frogel 1993;
Adams, Adamson & Giles
1983;
Giles 1986;
Joy et al. 1991;
Meadows & Allen 1992;
Turner et al. 1992;
Golombek, quoted in
Schreier et al. 1996)
in the 1-5µm
wavelength range. Near-infrared images longwards of 2µm,
usually show
a compact source close to the central position, but it is questionable
whether this represents direct emission from the nucleus (see e.g.
Antonucci & Barvainas
1990).
The relatively large-scale K-band maps by Quillen et al. (1993) and Adams et al. (1983) show a central 2.2µm peak embedded in an extended emission component in addition to several foreground stars. The extended emission is mostly due to the innermost stars of the elliptical galaxy, although there is also some emission from stars and HII regions in an inner dust lane of outer radius of 80" and projected thickness of 15" (Harding et al. 1981; Quillen et al. 1993; Adams et al. 1983; Meadows & Allen 1992). These K-band images show the "blossoming" of emission northeast of a dust absorption band, visible even at this wavelength, that extends across the nucleus. Below 2µm, the central feature is cometary in shape, points to the southwest in the same position angle as the X-ray/radio jet (Sect. 2.4) and is less compact than at longer wavelengths. The northeastern part of this feature corresponds to the UBVRI "hot spot" discovered by Kunkel & Bradt (who prematurely identified it with the nucleus). Joy et al. (1991) speculated that this cometary J/H-band "blue" source is the near-infrared counterpart of the X-ray/radio jet discussed in Sect. 2.4. However, its "blue" infrared colours and high degree of polarization are consistent with reflected light from a stellar or active nucleus in a clear line of sight (cf. Turner et al. 1992; Packham et al. 1996; Schreier et al. 1996), whereas the opening angle of the "blue" component is much wider than that of the radio/X-ray jets.
The position of peak emission moves to the southwest with increasing
wavelength (cf.
Schreier et al. 1996).
The accuracy of positional measurements
is insufficient to determine whether or not the K-band peak coincides
with the nucleus (for the best position determinations see
Giles 1986),
but data tabulated by
Schreier et al. (1996)
suggest it is still somewhat off.
Near-infrared polarimetry of the visually obscured centre of NGC 5128
has shown that, with increasing wavelength as well as with decreasing
aperture, the position angle of the polarized vectors steadily increases
from PA ![]() 120° to PA = 145°
(Bailey et al. 1986;
Packham et al. (1996),
i.e. from parallel to the dust band to parallel to
the circumnuclear disk and perpendicular to the radio jet. At the "nuclear
source", the intrinsic polarization is 17%.
Schreier et al. (1996)
further showed that this polarization peak coincides with a compact knot
close to both
the extinction and K-band emission peaks. The knot appears to be a heavily
obscured interstellar cloud, scattering the optical and near-infrared
radiation of the invisible nearby nucleus toward our line of sight.
The absence of significant polarization at millimetre wavelengths
led
Packham et al. (1996)
to reject
Bailey et al.'s (1986)
notion of an
intrinsically highly polarized nucleus, emitting near-infrared synchrotron
radiation and instead led them to conclude that the nucleus itself is
obscured
even at near-infrared wavelengths with AV = 16 mag and
that the
"nuclear" polarization is produced by scattering and not by synchrotron
emission or dichroic extinction.
120° to PA = 145°
(Bailey et al. 1986;
Packham et al. (1996),
i.e. from parallel to the dust band to parallel to
the circumnuclear disk and perpendicular to the radio jet. At the "nuclear
source", the intrinsic polarization is 17%.
Schreier et al. (1996)
further showed that this polarization peak coincides with a compact knot
close to both
the extinction and K-band emission peaks. The knot appears to be a heavily
obscured interstellar cloud, scattering the optical and near-infrared
radiation of the invisible nearby nucleus toward our line of sight.
The absence of significant polarization at millimetre wavelengths
led
Packham et al. (1996)
to reject
Bailey et al.'s (1986)
notion of an
intrinsically highly polarized nucleus, emitting near-infrared synchrotron
radiation and instead led them to conclude that the nucleus itself is
obscured
even at near-infrared wavelengths with AV = 16 mag and
that the
"nuclear" polarization is produced by scattering and not by synchrotron
emission or dichroic extinction.
Thus, the true nucleus is only fully revealed at wavelengths longer than
2.2µm, and the compact K-band source is mostly due to
reflected light. Indeed, the extinction of the nucleus itself is
variously estimated to be
15  AV
60, centering on
AV = 25-30 (see
Lépine et al. 1984;
Giles 1986;
Turner et al. 1992;
Meadows & Allen
1992,
and references therein). As this is much higher than the extinction caused
by the dust band (Sect. 4.4), the nucleus
must be obscured primarily by
the circumnuclear disk. Apart from the extinction problem, it is extremely
difficult to determine reliable flux-densities, colours or even the very
reality of weak unresolved K-band sources in galaxy centres, because of the
practical difficulties in separating such sources from the central cusp
of the surrounding galaxy
(Simpson 1994;
see also Fig. 8 by
Turner et al. 1992).
AV
60, centering on
AV = 25-30 (see
Lépine et al. 1984;
Giles 1986;
Turner et al. 1992;
Meadows & Allen
1992,
and references therein). As this is much higher than the extinction caused
by the dust band (Sect. 4.4), the nucleus
must be obscured primarily by
the circumnuclear disk. Apart from the extinction problem, it is extremely
difficult to determine reliable flux-densities, colours or even the very
reality of weak unresolved K-band sources in galaxy centres, because of the
practical difficulties in separating such sources from the central cusp
of the surrounding galaxy
(Simpson 1994;
see also Fig. 8 by
Turner et al. 1992).
The nucleus of NGC 5128 does appear as an infrared point source at 3.3
µm
(Turner et al. 1992)
and at 10µm (size
1" i.e.
16 pc; flux 1.4 Jy - P. van der Werf, private
communication); it also is variable at least at 3µm
(Lépine et al. 1984;
Turner et al. 1992;
see Sect. 5.6). Observations at longer infrared
wavelengths so far have lacked the resolution to accurately separate the
nucleus from the circumnuclear disk emission.
Infrared spectra centered on the nucleus show emission lines due to
molecular hydrogen (H2), Brackett-![]() and [FeII]
(Israel et al. 1990;
Meadows & Allen
1992),
but lack the noticeable CO-band
absorption (characteristic for late-type stellar populations) which
is seen off the nucleus where, in turn, the emission lines are absent
(Meadows & Allen,
1992).
The near-infrared colours of the central
area, in contrast to those of the "blue feature" mentioned above, are
extremely red, going from J - H = 1.5, H - K
= 0.9 in a 2.5" aperture
(Turner et al. 1992)
to J - H = 1.35, H - K = 1.75 in a 1"
aperture
(Giles 1986).
The very red colours are confined to a region within 12" from the
nucleus
(Giles 1986).
They are far too red be caused
by extinction. A rather similar situation has been found for NGC 3079 by
Israel et al. 1998
who interpret such colours as due to a combination of
extinction and emission from hot (1000 K) dust grains. Reddened synchrotron
emission, also considered by
Turner et al. (1992)
appears to be ruled out by the work of
Packham et al. (1996)
discussed above.
and [FeII]
(Israel et al. 1990;
Meadows & Allen
1992),
but lack the noticeable CO-band
absorption (characteristic for late-type stellar populations) which
is seen off the nucleus where, in turn, the emission lines are absent
(Meadows & Allen,
1992).
The near-infrared colours of the central
area, in contrast to those of the "blue feature" mentioned above, are
extremely red, going from J - H = 1.5, H - K
= 0.9 in a 2.5" aperture
(Turner et al. 1992)
to J - H = 1.35, H - K = 1.75 in a 1"
aperture
(Giles 1986).
The very red colours are confined to a region within 12" from the
nucleus
(Giles 1986).
They are far too red be caused
by extinction. A rather similar situation has been found for NGC 3079 by
Israel et al. 1998
who interpret such colours as due to a combination of
extinction and emission from hot (1000 K) dust grains. Reddened synchrotron
emission, also considered by
Turner et al. (1992)
appears to be ruled out by the work of
Packham et al. (1996)
discussed above.
5.4. The radio nucleus and nuclear jet
At the core of Centaurus A lies a compact radio nucleus for which (Kellerman, Zensus & Cohen (1997) have measured a size of 0.5 ± 0.1 milli-arcsec corresponding to linear dimensions of only 0.008 pc or 1700 AU). As there may be unresolved fine-scale structure even at this resolution, actual nuclear dimensions could be even smaller, the lower limit being about 1016 cm or 700 AU (Grindlay 1975; Mushotzky et al. 1978; Jourdain et al. 1993).
The nuclear source has a strongly inverted spectrum (![]()
![]() 4;
Jones et al 1996).
It is all but invisible below 5 GHz, but shows up in VLBI maps
at 8.4 GHz with significantly time-variable flux-densities ranging over
an order of magnitude
(Preston et al. 1983;
Meier et al. 1989;
Jauncey et al. 1995;
Jones et al. 1996;
Tingay et al. 1998).
Below about 20-30 GHz the radio
emission from the nucleus probably suffers from both synchrotron
self-absorption and free-free absorption in a circumnuclear ionized gas
(Jones et al. 1996).
Above the turnover frequency, the spectrum appears to
remain flat (flux-density about 8-10 Jy up to at least 1000 GHz (cf.
Kellerman et al. 1997).
4;
Jones et al 1996).
It is all but invisible below 5 GHz, but shows up in VLBI maps
at 8.4 GHz with significantly time-variable flux-densities ranging over
an order of magnitude
(Preston et al. 1983;
Meier et al. 1989;
Jauncey et al. 1995;
Jones et al. 1996;
Tingay et al. 1998).
Below about 20-30 GHz the radio
emission from the nucleus probably suffers from both synchrotron
self-absorption and free-free absorption in a circumnuclear ionized gas
(Jones et al. 1996).
Above the turnover frequency, the spectrum appears to
remain flat (flux-density about 8-10 Jy up to at least 1000 GHz (cf.
Kellerman et al. 1997).
Very high resolution (VLBI) radio measurements are needed to separate the
extremely compact nucleus from its surroundings. Over some 65 milli-arcsec
(projected linear distance 1 pc) a bright linear jet can be traced
emanating from the nucleus at a position angle of 51° and with a
width of a few milli-arcsec
(Preston et al. 1983;
Jones et al. 1996).
The VLBI maps by
Jones et al. (1996)
and Tingay et al. (1998)
show a weak counterjet to
the bright northeastern nuclear jet. The jet components have very similar
spectral indices
![]() = - 0.77 and, like the nucleus, are variable in intensity
(Meier et al. 1989).
Monitoring the jet over several years,
Tingay et al. (1998)
found significant
structural (c.q. intensity) changes of the knots in the jet
(Fig. 11),
implying internal evolution as well as a subluminal projected motion
v
= - 0.77 and, like the nucleus, are variable in intensity
(Meier et al. 1989).
Monitoring the jet over several years,
Tingay et al. (1998)
found significant
structural (c.q. intensity) changes of the knots in the jet
(Fig. 11),
implying internal evolution as well as a subluminal projected motion
v ![]() 0.1c of the knots.
0.1c of the knots.

|
Figure 11. VLBI maps of the core and nuclear jet at 8.4 GHz over the period 1991-1996 identifying major components, and showing jet motion. From Tingay et al. (1998). |
This observed motion may in fact represent slow patterns superposed
on a significantly faster relativistic jet flow
(Tingay et al. 1998).
The large difference in jet and counterjet brightnesses can be explained
by relativistic doppler beaming, enhancing the radiation of the jet
approaching us. From the observed brightness ratio of 4-8, it appears that
the northeastern jet is approaching and the southwestern jet receding at an
angle of 50°-80° to the line of sight at moderately
relativistic speeds v
0.45c
(Jones et al. 1996;
Tingay et al. 1998;
see also
Bao & Wiita 1997).
The two brightest knots C1 and C2 separated
recently from the nucleus, in 1983 and in 1989 respectively
(Tingay et al. 1998).
There is still a significant gap in radio coverage of the nuclear region
between aperture synthesis maps (5 GHz resolution 0.3":
Clarke et al. 1992)
and VLBI maps (8.4 GHz coverage ![]() 0.1":
Jauncey et al. 1995;
Tingay et al. 1998)
so that a full description of the nuclear jets is
still lacking. Since the nuclear jet velocities are much higher than those
estimated for the inner jet (Sect. 2.4),
significant deceleration must take
place just at the missing size range so that any possibility of filling the
observational gap should be pursued.
0.1":
Jauncey et al. 1995;
Tingay et al. 1998)
so that a full description of the nuclear jets is
still lacking. Since the nuclear jet velocities are much higher than those
estimated for the inner jet (Sect. 2.4),
significant deceleration must take
place just at the missing size range so that any possibility of filling the
observational gap should be pursued.
5.5. X- and ![]() -ray emission from the nuclear
region
-ray emission from the nuclear
region
The hard X-ray/soft ![]() -ray emission is thought to arise from Compton
up-scattering of lower energy photons by relativistic electrons; the
photons may be supplied by the relativistic electrons themselves via
the synchrotron self-Compton process, or by accretion heating. Major
outbursts, correlated at X-ray and radio wavelengths, would then represent
injection of fresh relativistic
electrons, or re-acceleration of Compton-cooled electrons. They should
decline on timescales determined by synchrotron loss rates, i.e., a few
years. Faster variations probably reflect source expansions
(Grindlay 1975;
Mushotzky et al. 1978;
Baity et al., 1981;
Skibo et al. 1994;
cf.
Bond et al. 1996).
Unlike the nucleus, at least the outer jets radiate primarily at
soft X-ray energies
(Feigelson et al. 1981;
Turner et al. 1997)
-ray emission is thought to arise from Compton
up-scattering of lower energy photons by relativistic electrons; the
photons may be supplied by the relativistic electrons themselves via
the synchrotron self-Compton process, or by accretion heating. Major
outbursts, correlated at X-ray and radio wavelengths, would then represent
injection of fresh relativistic
electrons, or re-acceleration of Compton-cooled electrons. They should
decline on timescales determined by synchrotron loss rates, i.e., a few
years. Faster variations probably reflect source expansions
(Grindlay 1975;
Mushotzky et al. 1978;
Baity et al., 1981;
Skibo et al. 1994;
cf.
Bond et al. 1996).
Unlike the nucleus, at least the outer jets radiate primarily at
soft X-ray energies
(Feigelson et al. 1981;
Turner et al. 1997)
The best available X-ray resolution, 6" provided by
the ROSAT HRI, is insufficient to separate the nucleus and the nuclear jets,
and even the innermost part of the inner jet. The energy distribution of
the nucleus has been characterized by power-law spectra
(Ubertini et al. 1993
Jourdain et al. 1993;
Miyazaki et al. 1996;
Sugizaki et al. 1997;
Turner et al. 1997)
with exponential cutoffs at 200-300 keV during periods of increased
activity and 700 keV during quiescent periods
(Kinzer et al. 1995).
Centaurus A is difficult to detect above energies of
1 MeV (see
Kinzer et al. 1995
and references therein) where the BL-Lac object MS1312-4221, 2° west of
Centaurus A is also a potentially serious source of
confusion
(Fichtel et al. 1994;
Kinzer et al. 1995;
Thompson et al. 1995).
In particular, detections in the 1-20 MeV range by
von Ballmoos et
al. (1987)
were not confirmed by
O'Neill et al. (1989),
although the latter observed the nucleus in a more intense
state. Likewise, an early detection at very high energies
(Grindlay et al. 1975)
could not be repeated
(Carramiñana et
al. 1990;
cf.
Allen et al. 1993).
However, observations with COMPTEL have now provided good detections
in the 1-30 MeV range
(Steinle et al. 1998),
which together with a 200 MeV EGRET detection
(Thompson et al. 1995)
allow the spectrum to be fitted with
sets of broken power laws, with spectral indices steepening from
![]() = - 1.7 to -2.0 to -2.6 for the low (L
= - 1.7 to -2.0 to -2.6 for the low (L![]() =
3 × 1042 erg s-1) intensity state and from
=
3 × 1042 erg s-1) intensity state and from
![]() = - 1.7
to -2.3 to -3.3 for the intermediate (L
= - 1.7
to -2.3 to -3.3 for the intermediate (L![]() =
5 × 1042 erg s-1) intensity state.
=
5 × 1042 erg s-1) intensity state.
Turner et al. (1997) concluded that nuclear emission dominates the X-ray flux above 2 keV and estimated that 40% of the source suffers extinction by a column NH = 4 × 10 23 cm-2, 59% by a column NH = 1 × 10 23 cm-2 and the remaining 1% by a column two orders of magnitude less. It is tempting to ascribe the first fraction to the nucleus itself, and the second to the nuclear jets, but there is no real evidence supporting this speculation. It is clear, in any case, that both components are obscured by the circumnuclear disk discussed in Sect. 5.2 whose estimated parameters fit the X-ray observations rather well. X-ray K-edge absorption and fluorescent emission from Fe at 6.4 keV (Mushotzky et al. 1978; Wang et al. 1986; Morini et al. 1989), but also Mg, Si and S (Sugizaki et al. 1997) can be explained by irradiation and reprocessing of clouds in the circumnuclear disk by the nuclear X-ray source (cf. Morini et al. 1989; Turner et al. 1997) and thus provide independent evidence for the fierce interaction of the nucleus with the inner parts of the circumnuclear disk.
5.6. Variability of the nucleus
Both the nucleus and the jet structures within at least 0.1' are
variable. As they do not seem to vary in tandem
(Tingay et al. 1998)
and
have different spectra, accurate determinations of the spectral
index and its time variation are extremely difficult to make especially
with relatively large single-dish beams.
At 1.4 GHz, considerable variability is seen on timescales of a hundred
days or longer
(Romero, Benaglia &
Combi 1997).
As the amplitude of
variation is large, and the nucleus is strongly (self)absorbed at this
frequency (Sect. 5.4), it cannot reflect activity in
the nucleus itself. Instead, shocks interacting with
density inhomogeneities in the inner jet appear
responsible. Well-established
variability at higher frequencies is harder to interpret. Large-beam
monitoring by
Botti & Abraham (1993)
has yielded large flux (22 GHz: 16-32
Jy; 43 GHz: 6-20 Jy) and spectral index variations (![]()
![]() = 2), while
Kellerman et al. (1997)
noted a 60% drop in 43 GHz intensity
over only 3 months. Qualitatively, this may reflect expansion of the
nuclear source and jets, initially opaque and then becoming (partially)
optically thin. However, the large beams used include significant
non-nuclear emission from the nuclear and inner jets, confusing the issue.
= 2), while
Kellerman et al. (1997)
noted a 60% drop in 43 GHz intensity
over only 3 months. Qualitatively, this may reflect expansion of the
nuclear source and jets, initially opaque and then becoming (partially)
optically thin. However, the large beams used include significant
non-nuclear emission from the nuclear and inner jets, confusing the issue.
Nevertheless, the radio variability appears to be correlated with that at hard X-ray wavelengths (Botti & Abraham 1993; Jourdain et al. 1993; Turner et al. 1997) which must be associated with the nucleus. The 3-12 keV light curve presented by Turner et al. (1997) for a 26-year period (based largely on the Vela 5B light-curve from Terrell 1986, and sparsely sampled after 1980) shows major outbursts in 1972-1976 and in 1979 (see also Feigelson et al. 1981; Baity et al. 1981; Gehrels et al. 1984; Bond et al. 1996) when the observed X-ray fluxes increased by an order of magnitude. These outbursts were separated by a low-intensity state with fluctuations by a factor of two. At millimetre wavelengths, likewise sampling nuclear behaviour, the 1972-1976 maximum is evident in the 90 GHz measurements by Kellermann (1974) and Beall et al. (1978). The 90-800 GHz measurements by Cunningham et al. (1984; see also Hwarden et al. 1993) show that the outburst starting in 1979 was still going on in 1981, which is also confirmed at 100 keV (Gehrels et al. 1984; Jourdain et al. 1993). A poorly covered outburst occurred in 1985 (Jourdain et al. 1993; Bond et al. 1996; Turner et al. 1997); this outburst may be associated with the expulsion of radio knot C1 (Tingay et al. 1998). The near-infrared 3.5µm variability noted by Lépine et al. (1984) and Turner et al. (1992) follows a pattern similar to that of the radio and X-ray emission (low in in 1971 and 1987, high in 1975 and 1981) suggesting that the emission at this wavelength arises from a similar or identical mechanism.
The observed 0.1-2 keV luminosity of the nuclear region increased by a
factor of two between 1990 and mid-1993. A probably related rise was
seen in the 43 GHz radio flux occurring at the end of 1992 lasting into
early 1993
(Abraham 1996).
However, no flux increase was seen at hard X-ray energies
(Turner et al. 1997;
Bond et al. 1996)
whereas 100/230 GHz monitoring by
Tornikoski et al. (1996)
reveals only modest ( 50%)
flux increases over relatively short times in 1992/1993 and 1994/1995.
As both hard X-rays and millimetre wave frequencies sample the nucleus
rather than the jets, this suggests that the soft X-ray/43 GHz increase
is related to the jet expansion observed by
Tingay et al. (1998)
and not to nuclear activity.
The hard X-ray flares of July/October 1991
(Jourdain et al. 1993;
Bond et al. 1996)
were unfortunately not covered by the millimetre monitoring
programme. The October 1991 flare is evident, however, in ![]() -ray observations by
Kinzer et al. (1995);
see also
-ray observations by
Kinzer et al. (1995);
see also ![]() -ray fluxes listed by
Steinle et al. (1998)
for the period 1991-1995, and their graph of the
hard X-ray variability over the same period showing significant activity in
mid-1994.
Minor X-ray flares in the low-intensity state have doubling times of
about two days and last for one or two weeks; they appear to occur
several times a year
(Terrell 1986;
Beall et al. 1987;
Jourdain et al. 1993;
Turner et al. 1997)
and involve energy transfers of order 1042 erg s-1
(Terrell 1986;
Bond et al. 1996).
The nucleus seems to have been in the
quiescent, low-intensity state for most of the time since 1989, as also
indicated by the 8.4 GHz VLBI core monitoring by
Tingay et al. (1998).
In addition to these variations, there is at least at X-ray and soft
-ray fluxes listed by
Steinle et al. (1998)
for the period 1991-1995, and their graph of the
hard X-ray variability over the same period showing significant activity in
mid-1994.
Minor X-ray flares in the low-intensity state have doubling times of
about two days and last for one or two weeks; they appear to occur
several times a year
(Terrell 1986;
Beall et al. 1987;
Jourdain et al. 1993;
Turner et al. 1997)
and involve energy transfers of order 1042 erg s-1
(Terrell 1986;
Bond et al. 1996).
The nucleus seems to have been in the
quiescent, low-intensity state for most of the time since 1989, as also
indicated by the 8.4 GHz VLBI core monitoring by
Tingay et al. (1998).
In addition to these variations, there is at least at X-ray and soft
![]() -ray wavelengths a considerable small-amplitude (10-20%)
variation at timescales of minutes and hours
(Morini et al. 1989;
Kinzer et al. 1995;
Miyazaki et al. 1996;
Turner et al. 1997,
but see also
Jourdain et al. 1993).
Very fast flux variations reported by
Wang et al. (1986)
have not been confirmed and are now generally doubted.
-ray wavelengths a considerable small-amplitude (10-20%)
variation at timescales of minutes and hours
(Morini et al. 1989;
Kinzer et al. 1995;
Miyazaki et al. 1996;
Turner et al. 1997,
but see also
Jourdain et al. 1993).
Very fast flux variations reported by
Wang et al. (1986)
have not been confirmed and are now generally doubted.