Copyright © 1998 by Annual Reviews. All rights reserved
| Annu. Rev. Astron. Astrophys. 1998. 36:
435-506 Copyright © 1998 by Annual Reviews. All rights reserved |


Mould & Aaronson (1983) published deep CCD photometry of the nearby Carina dSph galaxy and showed conclusively that it is dominated by intermediate-age (4-8 Gyr) stars. Although there was already compelling evidence to suggest that some of the dSph galaxies might contain relatively young stars (Zinn 1980), it was still widely assumed that dSph galaxies such as Carina were all ancient stellar systems, much like globular clusters. The balance of opinion has nearly completely reversed, and it is widely believed that few, if any, Local Group dwarf galaxies contain only ancient stars. Some recent reviews of the exciting developments of this field have been written by Da Costa (1994a, b, 1998), Hodge (1994), Stetson (1997), Grebel (1997).
6.1. Basic Techniques and Ingredients
The key ingredient to deciphering the fossil record of star formation in nearby galaxies is deep CCD photometry of individual stars. Methods that rely on analysis of the most luminous young stars, HII regions, or the integrated galaxy colors at a variety of wavelengths (Hodge 1980, Kennicutt 1983, Gallagher et al 1984) invariably lose age resolution for populations older than about 1 Gyr. As shown below, many Local Group dwarfs were very active during that entire time interval.
Recent technical developments have greatly expanded our ability to constrain the star-formation histories of individual galaxies. Optical and IR detectors have greatly improved in quality and size. Improved computing capabilities have also been essential to progress in this field. Extensive simulations of observations are required to correct for effects such as crowding, internal reddening, incompleteness, and photometric errors (e.g. Aparicio & Gallart 1995, Gallart 1996a,b, Tolstoy 1996, Martínez-Delgado & Aparicio 1997, Hurley-Keller et al 1998). The expansion of grids of stellar-evolutionary models has also been crucial (Schaller et al 1992, Bertelli et al 1994): Observations of local dwarf galaxies have driven us into regions of parameter space - low age and low metallicity - where we have never before had to venture.
6.2. Age Indicators in Local Group Dwarfs
A galaxy's star-formation history can be determined by simultaneously comparing its photometric data with appropriate composite models, suitably corrected for observational effects (Bertelli et al 1994, Aparicio & Gallart 1995, Gallart et al 1996a, b, Tolstoy & Saha 1996, Hurley-Keller et al 1998). This powerful approach can, in principle, constrain the entire star formation and chemical history of a galaxy. Of course, the method depends critically on the precision of the input models and on its implicit assumptions, e.g. that the chemical enrichment is a monotonically rising function of time. A heuristic drawback of this approach is that the process is not terribly intuitive; consequently, I discuss here specific evolutionary phases that have proven especially useful as age tracers and note the age range over which they can be used. The theoretical Hertzprung-Russell (HR) diagrams of Schaller et al (1992; their figures 1 and 2) and figure 1 of Gallart et al (1996b) are particularly helpful guides to the evolutionary phases discussed here. A good general discussion is given by Chiosi et al (1992).
WOLF-RAYET STARS These high-mass stars signal vigorous star formation during the past 10 Myr (Massey 1998). The frequency of Wolf-Rayet stars depends on mass-loss rates, metallicity, the star-formation rate for high-mass stars, and the high-mass end of the initial mass function (IMF) (Meynet et al 1994, Massey & Armandroff 1995, Massey 1998). Among Local Group dwarfs, only IC 1613, NGC 6822 and IC 10 are known to contain Wolf-Rayet stars.
BLUE-LOOP STARS Stars of intermediate mass evolve through prolonged "blue loops" after they ignite He in their cores. The luminosities at which the loops occur depend principally on the mass of the star, though the color and extent of the loop is critically sensitive to metallicity. For stars ranging in age from 100-500 Myr, the loop luminosities (LBL) fade monotonically with age. Dohm-Palmer et al (1997) used deep HST photometry that clearly separates the upper main-sequence and blue-loop stars in the color-magnitude diagram of Sextans A. They constructed a luminosity function (LF) for the blue loop stars that is uncontaminated by other evolutionary phases. Because of the nearly one-to-one correspondance of luminosity and age for these stars, they were able to then directly convert the LF into the star-formation history of Sextans A with only an age-LBL relation from models. Cepheid variables are closely associated with blue-loop evolution (Chiosi et al 1992, Schaller et al 1992).
RED SUPERGIANTS Mermilliod (1981) demonstrated that red supergiants also fade monotonically with age for populations ranging from about 10-500 Myr in age. However, these stars exhibit a moderate spread in luminosity at a given age. For a composite system - such as a dwarf galaxy - the red supergiant LF will contain stars exhibiting a range of ages at a given luminosity. Both the blue-loop and red supergiant phases are short-lived (Maeder & Meynet 1988, Chiosi et al 1992, Schaller et al 1992, Wilson 1992a) and, therefore, subject to added uncertainties from the stochastic nature of star formation, particularly in dwarfs (Aparicio & Gallart 1995).
ASYMPTOTIC GIANT BRANCH STARS Gallart et al (1996a, b) descriptively refer to the AGB as the "red tail" extending redward from the RGB. They also discuss in detail the practical problems of using the AGB to derive quantitatively the intermediate-age star-formation history of a galaxy. Figure 23 of Gallart et al (1996b) shows clearly that the details the mass-loss prescription used to model the AGB is critical to properly describe AGB evolution (see also Charbonnel et al 1996). Consequently, ages for AGB stars probably cannot be determined to better than a factor of 2-3. Nevertheless, AGB stars often provide our only constraint on stellar populations older than ~ 1 Gyr in many distant galaxies within and beyond the Local Group. Long-period variables are often found among luminous AGB stars (Olszewski et al 1996b).
RED GIANT BRANCH STARS The RGB plays an important role in understanding the chemical-enrichment histories of dwarf galaxies (Section 5.1), largely because its properties are relatively insensitive to age. Unfortunately, for a given metallicity, stars spanning a large age range are funneled into a very narrow corridor within optical color-magnitude diagrams (Chiosi et al 1992, Schaller et al 1992). The RGB serves only as a relatively crude age indicator for populations older than 1 Gyr (Schaller et al 1992, Ferraro et al 1995). Long-period variables are found near the upper tip of the RGB (Caldwell et al 1998, Olszewski et al 1996b).
RED-CLUMP AND HORIZONTAL BRANCH STARS
The He core burning phase occurs in a "red clump" located at the base of
the RGB for populations with ages in the range 1-10 Gyr. The
detailedevolution of this clump has been studied recently by
Caputo et al (1995);
its empirical behavior as a function of age in Magellanic
Cloud star clusters has been determined by
Hatzidimitriou
(1991).
The clump evolution in luminosity
( 1 mag) and color
( 0.5 mag) is small
even for large age differences.
1 mag) and color
( 0.5 mag) is small
even for large age differences.
Horizontal branch (HB) stars - also undergoing core He burning - signal the
presence of ancient populations
( 10 Gyr;
Olszewski et al
1996b).
RR Lyr stars are an easily identified example of HB stars; blue HB stars
are also distinctive but are known to exist in only two Local Group
dwarfs (Carina and Ursa Minor), while RR Lyr stars have been found in 13
systems
(Section 9). The red HB is also indicative of an old
population, but distinguishing it from the red clump in an
intermediate-age population can be difficult
(Lee et al 1993a,
Caputo et al 1995).
A beautiful example of the relationship of red-clump and blue HB stars
is shown by
Smecker-Hane et al
(1994)
for Carina.
10 Gyr;
Olszewski et al
1996b).
RR Lyr stars are an easily identified example of HB stars; blue HB stars
are also distinctive but are known to exist in only two Local Group
dwarfs (Carina and Ursa Minor), while RR Lyr stars have been found in 13
systems
(Section 9). The red HB is also indicative of an old
population, but distinguishing it from the red clump in an
intermediate-age population can be difficult
(Lee et al 1993a,
Caputo et al 1995).
A beautiful example of the relationship of red-clump and blue HB stars
is shown by
Smecker-Hane et al
(1994)
for Carina.
SUBGIANT BRANCH STARS Stars with main-sequence lifetimes longer than about 2-4 Gyr evolve slowly towards the RGB after they exhaust hydrogen in their cores, resulting in a well-populated subgiant branch below the luminosity of the HB/red-clump stars (Meynet et al 1993). At a given metallicity, the minimum luminosity of subgiant branch stars fades monotonically with increasing age. Bertelli et al (1992), Hurley-Keller et al (1998) rely heavily on the subgiant branch to determine the star-formation history of composite populations.
MAIN-SEQUENCE STARS The main sequence is the only evolutionary phase present in populations of all ages. Unlike the subgiant branch, the maximum luminosity of the main sequence (the main-sequence turnoff) fades with increasing age. When an age spread is present, older populations can be hidden by the unevolved main-sequence stars of younger populations. However, used in conjunction with the subgiant branch, the main sequence provides the only method of determining ages for populations older than 1-2 Gyr with ~ 1 Gyr resolution (Bertelli et al 1992, Holtzman et al 1997, Hurley-Keller et al 1998). The main sequence has one particularly useful feature: The maximum luminosity on the main sequence can always be related to the age of the youngest population at the precision of sampling uncertainties. Short-period dwarf Cepheids are associated with metal-poor main-sequence population (Nemec et al 1994, McNamara 1995, Mateo et al 1998b).
6.3. A Compilation of Star-Formation Histories of Local
Group Dwarfs
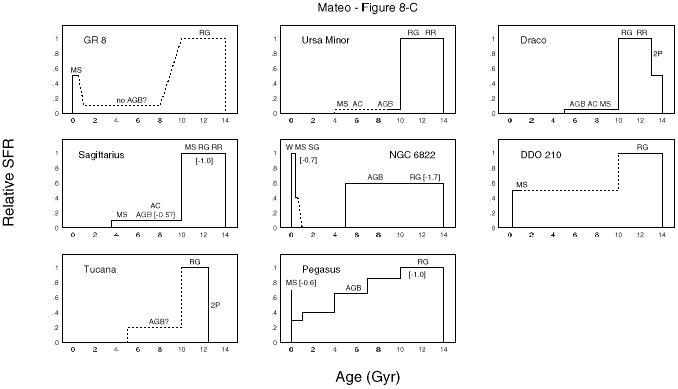
Figure 8. Schematic plots of the
star-formation
histories of all Local Group dwarfs with sufficient data. The labels
within the individual panels specify the nature of the
stellar indicators used to infer the presence of a given age
component: MS = main-sequence stars; AGB = asymptotic giant branch
stars; RG = red giants; RR = RR Lyr variables; AC = anomalous
Cepheids; SG = blue and red
supergiants; W = Wolf-Rayet stars; PN = planetary nebulae.
"2P" means that the galaxy has an anomalously red
horizontal-branch (HB) population for its (low) metallicity - that is, the
galaxy exhibits the second parameter effect. Numbers within
square brackets denote the metallicities of specific star-forming
epochs; this information is generally quite uncertain and is available
for only a few systems.
The reliability of the various star-formation episodes for a given
galaxy is denoted by the style of the lines use to plot them: solid
horizontal lines indicate that the duration of a given age component
is fairly well determined; solid vertical lines indicate that the
relative star-formation rate of a given event with respect to other
star-formation episodes is reasonably well constrained; dashed
horizontal and vertical lines indicate very great uncertainties in
the duration or relative strength of individual star-formation
periods. The galaxies are plotted in the same order that they are
listed in the tables by increasing right ascension. Some of the
galaxies listed as Local Group members in
Table 2 are not plotted
because of insufficient data, usually for the old and intermediate-age
populations. Many of these cases are discussed in the text. For a few
galaxies, separate panels show the star-formation
histories of the inner and outer regions.
REFERENCES FOR FIGURE 8: WLM:
Sandage & Carlson
(1985b),
Cook et al (1986),
Ferraro et al
(1989),
Minniti & Zijlstra
(1996);
NGC 147:
Mould et al (1983),
Saha et al (1990),
Davidge (1994),
Han et al (1997);
And III:
Armandroff et al (1993);
NGC 185:
Saha & Hoessel
(1990),
Lee et al (1993b);
NGC 205:
Mould et al (1984),
Richer et al
(1984),
Saha et al (1992b),
Lee (1996);
M32:
Davidge & Jones
(1992),
Freedman (1992),
Elston & Silva
(1992),
Grillmair et al (1996);
And I:
Da Costa et al (1996);
Sculptor:
Da Costa (1984),
Azzopardi et al
(1985,
1986);
LGS 3:
Lee (1995a),
Aparicio et al (1997b);
IC 1613: Freedman (1988),
Saha et al (1992a);
Phoenix:
Ortolani & Gratton
(1988),
van de Rydt et al
(1991);
Fornax:
Buonanno et al
(1985),
Demers et al (1995),
Beauchamp et al
(1995),
Demers et al
(1998);
Carina:
Mould & Aaronson
(1983),
Azzopardi et al
(1985,
1986),
Mighell (1990,
1997),
Smecker-Hane et al
(1994),
Hurley-Keller et al
(1998);
Leo A:
Tolstoy et al
(1998);
Sextans B:
Tosi et al (1991),
Marconi et al
(1995);
NGC 3109:
Richer & McCall
(1992),
Greggio et al
(1993),
Davidge (1993),
Bresolin et al (1993);
Antlia:
Aparicio et al
(1997a),
Sarajedini et al
(1997),
Whiting et al (1997);
Leo I:
Azzopardi et al
(1985,
1986),
Reid & Mould
(1991),
Caputo et al (1995),
Gallart et al
(1998);
Sextans A: Dohm-Palmer et al (1997);
Sextans:
Mateo
et al (1991a),
Suntzeff et al
(1993),
Mateo et al
(1995a);
Leo II:
Azzopardi et al
(1985),
Mighell & Rich
(1996); GR 8:
Dohm-Palmer et al
(1998); Ursa Minor:
Olszewski &
Aaronson (1985);
Draco:
Carney
& Seitzer (1986),
Azzopardi et al
(1986),
Grillmair et al
(1998);
Sagittarius:
Ibata et al (1994),
Mateo et al
(1995b),
Sarajedini & Layden
(1995),
Mateo et al (1996),
Alard (1996),
Fahlman et al
(1996),
Ibata et al (1997),
Marconi et al
(1998);
NGC 6822:
Hodge (1980),
Armandroff & Massey
(1991),
Gallagher et al
(1991),
Wilson (1992a),
Marconi et al
(1995),
Gallart et al
(1996a,
b,
c);
DDO 210:
Marconi et al
(1990),
Greggio et al
(1993);
Tucana:
Lavery & Mighell
(1992),
Saviane et al
(1996),
Castellani et al
(1996);
Pegasus:
Aparicio & Gallart
(1995),
Aparicio et al (1997b).
A number of important conclusions regarding the star-formation history
of Local
Group dwarf galaxies can be drawn from Figure 8.
Most of the remaining galaxies listed in
Table 2 that are not represented in
Figure 8 simply have insufficient data for even
an educated guess of
their entire star-formation histories. One galaxy deserves special mention.
Massey & Armandroff
(1995)
noted that IC 10 has the highest surface density
of Wolf-Rayet stars of any region in any Local Group galaxy. Two
H2O masers - also
considered to be tracers of high-mass star formation - have been
found in IC 10
(Becker et al 1993).
Radio continuum and optical
H
Some galaxies are plotted in Figure 8 twice
because of evidence that
they exhibit significantly different star-formation histories in their
inner and outer regions. Radial population gradients have been
detected in many early-type systems (And I, Leo II, Sculptor, but not
Carina:
Da Costa et al 1996;
NGC 205:
Jones et al 1996;
Antlia:
Aparicio et al
1997a),
often as a gradient in the HB morphology.
Aparicio et al
(1997a)
commented on the core/halo morphology now evident in some Local Group
dIrr systems (see also
Minniti & Zijlstra
1996).
Mighell (1997)
argued that the strong intermediate-age burst of star-formation in
Carina started in the center of that galaxy and then
progressed outward.


 imaging reveal evidence of
an enormous multiple-supernova-driven bubble
(Hunter et al 1993,
Yang & Skillman
1993).
The inferred star-formation rate of IC 10
(Table 5) is the highest by far of any
Local Group dwarf.
By comparison, if Carina formed its entire dominant intermediate-age
population in 10 Myr, its total star-formation rate would only slightly
have exceeded what we see today in IC 10
(Hurley-Keller et al 1998).
imaging reveal evidence of
an enormous multiple-supernova-driven bubble
(Hunter et al 1993,
Yang & Skillman
1993).
The inferred star-formation rate of IC 10
(Table 5) is the highest by far of any
Local Group dwarf.
By comparison, if Carina formed its entire dominant intermediate-age
population in 10 Myr, its total star-formation rate would only slightly
have exceeded what we see today in IC 10
(Hurley-Keller et al 1998).