


Epimetheus: Wie vieles ist denn dein?
Prometheus: Der Kreis, den meine Wirksamkeit erfüllt!
Epimetheus: What then do you possess?
Prometheus: My sphere of influence - nothing more and nothing less!
Goethe, Prometheus
2.1. A Discrepancy, and its Resolution
By 1999, a clear discrepancy was emerging between black hole masses derived from stellar kinematical studies and most other techniques. The former sample included many "standard bearers" like M31 (Richstone, Bower & Dressler 1990), NGC 3115 (Kormendy et al. 1996a) and NGC 4594 (Kormendy et al. 1996b). The size of the discrepancy was difficult to pin down since there were (and still are) essentially no galaxies for which black hole masses had been independently derived using more than one technique. However the masses derived from ground-based stellar kinematics were much larger, by roughly an order of magnitude on average, than those inferred from other techniques when galaxies with similar properties were compared, or when estimates of the cosmological density of black holes or the mean ratio of black hole mass to bulge mass were made. The discrepancy was clearest in two arenas:
 -
Lbulge
relation defined by ground-based, stellar kinematical data
(Wandel 1999,
2000).
-
Lbulge
relation defined by ground-based, stellar kinematical data
(Wandel 1999,
2000).
 ~ 2 × 10⁵
M
~ 2 × 10⁵
M Mpc-3
(Chokshi & Turner
1992;
Salucci et al. 1999).
A similar argument based on the X-ray background gives
consistent results,
~ 3 × 10⁵
M
Mpc-3
(Fabian & Iwasawa
1999;
Salucci et al. 1999).
By comparison, the black hole mass density implied by
stellar kinematical modelling was about ten times higher
(Magorrian et al. 1998;
Richstone et al. 1998;
Faber 1999).
Mpc-3
(Chokshi & Turner
1992;
Salucci et al. 1999).
A similar argument based on the X-ray background gives
consistent results,
~ 3 × 10⁵
M
Mpc-3
(Fabian & Iwasawa
1999;
Salucci et al. 1999).
By comparison, the black hole mass density implied by
stellar kinematical modelling was about ten times higher
(Magorrian et al. 1998;
Richstone et al. 1998;
Faber 1999).
Serious inconsistencies like these only appeared when comparisons were
made with black hole masses derived from the stellar kinematical data;
all other techniques gave roughly consistent values for
and
<M /
Mbulge>.
Nevertheless, most authors accepted the correctness of the
stellar dynamical mass estimates and looked elsewhere to explain
the discrepancies.
Ho (1999)
suggested that the reverberation mapping masses had been
systematically underestimated.
Wandel (1999)
proposed that black holes in active galaxies were
smaller on average than those in quiescent galaxies, due either
to different accretion histories or to selection effects.
Richstone et al. (1998)
and Faber (1999)
suggested that the inconsistency
between their group's masses and the masses inferred from quasar light
could be explained if black holes had acquired 80% of
their mass after the quasar epoch
through some process that produced no observable radiation.
|
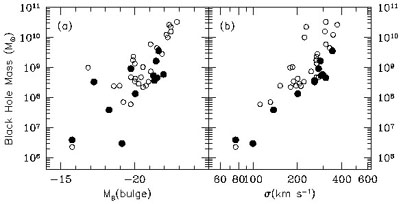
Figure 1. Discovery of the
M |
What particularly caught our attention was the gulf between black hole
masses derived from high- and low-resolution data, and
(to a lesser extent) between gas- and stellar dynamical data;
the former (e.g.
Ferrarese, Ford &
Jaffe 1996;
Ferrarese & Ford
1999)
were typically taken at higher resolution than the latter.
Black hole masses derived from the highest resolution data,
in galaxies like the Milky Way
(Ghez et al. 1998;
Genzel et al. 2000)
and M87
(Macchetto et al. 1997),
were the
smallest when expressed as a fraction of the bulge mass, with
M /
Mbulge
 10-3.
The largest fractional black hole masses - in galaxies like
NGC 3377
(Kormendy et al. 1998)
or NGC 4486b
(Kormendy et al. 1997) -
were mostly derived from stellar absorption-line spectra obtained from the
ground, at resolutions of ~ 1", corresponding to typical
linear scales of 10 - 100 pc. The mean value of
M /
Mbulge for these galaxies was claimed
to be about 10-2
(Magorrian et al. 1998;
Richstone et al. 1998),
roughly an order of magnitude
greater than the value derived from the high-resolution data.
We began to suspect that some of the masses derived from the
lower-quality data might be serious over-estimates
- or, even worse, that some of the "detections" based on these
data were spurious.
10-3.
The largest fractional black hole masses - in galaxies like
NGC 3377
(Kormendy et al. 1998)
or NGC 4486b
(Kormendy et al. 1997) -
were mostly derived from stellar absorption-line spectra obtained from the
ground, at resolutions of ~ 1", corresponding to typical
linear scales of 10 - 100 pc. The mean value of
M /
Mbulge for these galaxies was claimed
to be about 10-2
(Magorrian et al. 1998;
Richstone et al. 1998),
roughly an order of magnitude
greater than the value derived from the high-resolution data.
We began to suspect that some of the masses derived from the
lower-quality data might be serious over-estimates
- or, even worse, that some of the "detections" based on these
data were spurious.
To test this hypothesis, we tabulated all of the published black
hole masses that had been derived from stellar- or gas kinematical
data (excluding the reverberation mapping masses) and divided
them into two groups based on their expected accuracy.
This is not quite as easy as it sounds, since the "accuracy"
of a black hole mass estimate is not necessarily related
in any simple way to its published confidence range.
Our criterion was simply the quality of the data:
"accurate" black hole masses were those derived
from HST data, at resolutions of ~ 0.1", as well as
M for
the Milky Way black hole (which is by far the
nearest) and the black hole in NGC 4258 (for which VLBI gives
a resolution of ~ 0.1 pc).
The velocity data for these galaxies (our "Sample A") was always
found to exhibit a clear rise in the inner few data points,
suggesting that the black hole's sphere of influence
rh  GM /
GM /
 2 had been well
resolved. The remaining black hole masses ("Sample B") were all those
derived from lower-resolution data, typically ground-based
stellar kinematics, including most of the masses in the
Magorrian et al. (1998)
study. Sample A contained 12 galaxies, Sample B 31.
2 had been well
resolved. The remaining black hole masses ("Sample B") were all those
derived from lower-resolution data, typically ground-based
stellar kinematics, including most of the masses in the
Magorrian et al. (1998)
study. Sample A contained 12 galaxies, Sample B 31.
Our first attempt to compare "Sample A" and "Sample B" masses
was disappointing (Figure 1a). In the
M -
Lbulge plane,
the Sample A masses do fall slightly below those from Sample B,
but the intrinsic scatter in Lbulge is apparently so
large that there is no clear difference in the relations defined by the
two samples.
But when we plotted
M versus
the velocity dispersion
of the bulge stars, something magical happened
(Figure 1b): now the
Sample A galaxies clearly defined the lower edge of the
relation, while the Sample B galaxies scattered above,
some by as much as two orders of magnitude in
M!
Furthermore the correlation defined by the Sample A galaxies
alone was very tight.
What particularly impressed us about the
M -
plot was the fact that
the Sample A galaxies, which are diverse in their properties,
showed such a tight correlation; while the Sample B galaxies, which are much
more homogeneous, exhibited a large scatter.
For instance, Sample A contains two spiral galaxies, two lenticulars,
and both dwarf and giant ellipticals; while the Sample B
galaxies are almost exclusively giant ellipticals.
Furthermore the black hole masses in Sample A were derived using
a variety of techniques, including absorption-line stellar kinematics
(M32, NGC 4342),
dynamics of gas disks (M87, NGC 4261),
and velocities of discrete objects (MW, NGC 4258);
while in Sample B all of the black hole masses were derived from
stellar spectra obtained from the ground.
This was circumstantial, but to us compelling, evidence
that the Sample A masses were defining the true relation and
that the Sample B masses were systematically in error.
Fitting a regression line to
logM vs.
log for
the Sample A galaxies alone, we found
| (1) |
with  = 4.80 ± 0.5
(Ferrarese & Merritt
2000).
We defined the quantity
c to be the rms
velocity of stars in an aperture
of radius re/8 centered on the nucleus, with
re the half-light radius of the bulge.
This radius is large enough that the stellar
velocities are expected to be affected at only the few percent
level by the gravitational force from the black hole, but small enough that
c can easily be
measured from the ground.
= 4.80 ± 0.5
(Ferrarese & Merritt
2000).
We defined the quantity
c to be the rms
velocity of stars in an aperture
of radius re/8 centered on the nucleus, with
re the half-light radius of the bulge.
This radius is large enough that the stellar
velocities are expected to be affected at only the few percent
level by the gravitational force from the black hole, but small enough that
c can easily be
measured from the ground.
A striking feature of the
M -
relation is its negligible
scatter. The reduced  2 of
Sample A about the best-fit line of Eq. 1,
taking into account measurement errors in both variables,
is only 0.74, essentially a perfect fit.
Such a tight correlation seemed almost too good to be true
(and may in fact be a fluke resulting from the small sample size)
but we felt we could not rule it out given the existence of
other, similarly tight correlations in astronomy, e.g.
the near-zero thickness of the elliptical galaxy fundamental plane.
2 of
Sample A about the best-fit line of Eq. 1,
taking into account measurement errors in both variables,
is only 0.74, essentially a perfect fit.
Such a tight correlation seemed almost too good to be true
(and may in fact be a fluke resulting from the small sample size)
but we felt we could not rule it out given the existence of
other, similarly tight correlations in astronomy, e.g.
the near-zero thickness of the elliptical galaxy fundamental plane.
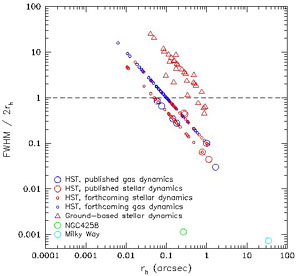
|
Figure 2. Detectability of black holes in
galaxies for which dynamical
mass determinations have been published or are planned.
Horizontal axis is
rh |
In fact the scatter in the
M -
relation is so small that it is
reasonable to use the relation to predict black hole masses,
even in galaxies for which determinations of
M
based on detailed modelling have previously been published.
One can then ask, galaxy by galaxy,
whether the observations on which the published estimate of
M was
based were of sufficiently high quality to
resolve the black hole's sphere of influence.
Table 1 and Figure 2 show
the results.
Table 1 is a ranked list of the most secure black
hole detections to date.
The galaxies are listed in order of increasing
FWHM / 2rh, i.e. the ratio of the size of the
resolution
element to twice the radius of influence of the black hole.
In the case of HST observations, for which the PSF is undersampled, FWHM
is the diameter of the FOS aperture or the width of the STIS slit.
For ground-based observations, FWHM refers to the seeing disk.
Figure 2 plots the same quantities for
essentially all galaxies with published estimates of
M based
on stellar or gas kinematics.
Not surprisingly, only the black holes in the Milky Way and in NGC 4258 have been observed at a resolution greatly exceeding rh. The Sample A galaxies of Ferrarese & Merritt (2000) also satisfy FWHM / 2rh < 1, although sometimes marginally. By contrast, almost none of the ground-based data resolved rh, sometimes failing by more than a factor of 10.
| Galaxy | Type | Distance |
M
| c
| FWHM/2rh | Reference |
| Galaxies for which rh has been resolved | ||||||
| MW | SbI-II | 0.008 | 0.0295±0.0035 | 100±20 | 7.3-4 | Genzel et al. 2000 |
| N4258 | SAB(s)bc | 7.2 | 0.390±0.034 | 138±18 | 1.1-3 | Miyoshi et al. 1995 |
| N4486 | E0pec | 16.7 | 35.7±10.2 | 345±45 | 0.03 | Macchetto et al. 1997 |
| N3115 | S0- | 9.8 | 9.2±3.0 | 278±36 | 0.04 | Emsellem et al. 1999 |
| N221 | cE2 | 0.8 | 0.039±0.009 | 76±10 | 0.06 | Joseph et al. 2000 |
| N5128 | S0pec | 4.2 | 2.4 3.6-1.7 | 145±25 | 0.10 | Marconi et al. 2001 |
| N4374 | E1 | 18.7 | 17 +12-6.7 | 286±37 | 0.10 | Bower et al. 1998 |
| N4697 | E6 | 11.9 | 1.7 +0.2-0.3 | 163±21 | 0.10 | "Nuker" group, unpubl.3 |
| N4649 | E2 | 17.3 | 20.6 +5.2-10.2 | 331±43 | 0.10 | "Nuker" group, unpubl.3 |
| N4261 | E2 | 33.0 | 5.4 +1.2-1.2 | 290±38 | 0.18 | Ferrarese et al. 1996 |
| M81 | SA(s)ab | 3.9 | 0.68 0.07-0.13 | 174±17 | 0.19 | STIS IDT, unpubl.3 |
| N4564 | E | 14.9 | 0.57 +0.13-0.17 | 153±20 | 0.33 | "Nuker" group, unpubl.3 |
| I1459 | E3 | 30.3 | 4.6±2.8 | 312±41 | 0.35 | Verdoes Kleijn et al. 2000 |
| N5845 | E* | 28.5 | 2.9 +1.7-2.7 | 275±36 | 0.40 | "Nuker" group, unpubl.3 |
| N3379 | E1 | 10.8 | 1.35±0.73 | 201±26 | 0.44 | Gebhardt et al. 2000a |
| N3245 | SB(s)b | 20.9 | 2.1±0.5 | 211±19 | 0.48 | Barth et al. 2001 |
| N4342 | S0- | 16.7 | 3.3 +1.9-1.1 | 261±34 | 0.56 | Cretton & van den Bosch 1999 |
| N7052 | E | 66.1 | 3.7 +2.6-1.5 | 261±34 | 0.66 | van der Marel & van den Bosch 1998 |
| N4473 | E5 | 16.1 | 0.8 +1.0-0.4 | 188±25 | 0.77 | "Nuker" group, unpubl.3 |
| N6251 | E | 104 | 5.9±2.0 | 297±39 | 0.84 | Ferrarese & Ford 1999 |
| N2787 | SB(r)0+ | 7.5 | 0.41 0.04-0.05 | 210±23 | 0.87 | Sarzi et al. 2001 |
| N3608 | E2 | 23.6 | 1.1 +1.4-0.3 | 206±27 | 0.98 | "Nuker" group, unpubl.3 |
| Galaxies for which rh has not been resolved | ||||||
| N3384 | SB(s)0- | 11.9 | 0.14 +0.05-0.04 | 151±20 | 1.0 | "Nuker" group, unpubl.3 |
| N4742 | E4 | 15.5 | 0.14 0.04-0.05 | 93±10 | 1.0 | STIS IDT, unpubl.3 |
| N1023 | S0 | 10.7 | 0.44±0.06 | 201±14 | 1.1 | STIS IDT, unpubl.3 |
| N4291 | E | 26.9 | 1.9 +1.3-1.1 | 269±35 | 1.1 | "Nuker" group, unpubl.3 |
| N7457 | SA(rs)0- | 13.5 | 0.036 +0.009-0.011 | 73±10 | 1.1 | "Nuker" group, unpubl.3 |
| N821 | E6 | 24.7 | 0.39 +0.17-0.15 | 196±26 | 1.3 | "Nuker" group, unpubl.3 |
| N3377 | E5+ | 11.6 | 1.10 +1.4-0.5 | 131±17 | 1.3 | "Nuker" group, unpubl.3 |
| N2778 | E | 23.3 | 0.13 +0.16-0.08 | 171±22 | 2.8 | "Nuker" group, unpubl.3 |
| Galaxies in which dynamical studies are inconclusive | ||||||
| N224 | Double nucleus, system not in dynamical equilibrium. | Bacon et al. 2001 | ||||
| N598 | Data imply upper limit only,
 103
M. 103
M.
| Merritt, Ferrarese & Joseph 2001 | ||||
| N1068 | Velocity curve is sub-Keplerian. | Greenhill et al. 1996 | ||||
| N3079 | Masers do not trace a clear rotation curve. | Trotter et al. 1998 | ||||
| N4459 | Data do not allow unconstrained fits. | Sarzi et al. 2001 | ||||
| N4486B | Double nucleus, system not in dynamical equilibrium. | STIS IDT, unpubl.2 | ||||
| N4945 | Asymmetric velocity curve; velocity is sub-Keplerian. | Greenhill et al. 1997 | ||||
| 1 Type is revised Hubble type. Black hole
masses are in 108 solar masses, velocity dispersions are in km
s-1, and distances are in Mpc.
c is the
aperture-corrected velocity dispersion defined by
Ferrarese & Merritt (2000).
rh =
GM /
c2, with
M the
value in column 4.
References in column 7 are to the papers in which the dynamical
analysis leading to the mass estimate were published.
| ||||||
| 2 For the reasons outlined in the text, the masses from Magorrian et al. (1998) are omitted from this tabulation. This includes NGC 4594, which was included in Kormendy & Gebhardt (2001). | ||||||
| 3 Preliminary masses tabulated in Kormendy & Gebhardt (2001). Data and modelling for these mass estimates are not yet available. | ||||||
The latter point is important, since precisely these
data were used to define the canonical relation between
black hole mass and bulge luminosity
(Magorrian et al. 1998;
Richstone et al. 1998;
Faber 1999)
that has served as the basis for so many subsequent studies (e.g.
Haehnelt, Natarajan &
Rees 1998;
Catteneo, Haehnelt &
Rees 1999;
Salucci et al. 1999;
Kauffmann & Haehnelt
2000;
Merrifield, Forbes &
Terlevich 2000).
Figure 3 plots the likely "error" in the
ground-based mass estimates (defined as the ratio of the quoted mass,
Mfit, to the mass implied by Eq. 1)
as a function of the effective resolution
FWHM / 2rh. The error
is found to correlate strongly with the quality of the data.
For the best-resolved of the Magorrian et al. candidates,
FWHM/2rh
1,
the average error in
M
appears to be a factor of ~ 3, rising roughly linearly with
FWHM/rh to values of
~ 102 for the most poorly-resolved candidates.
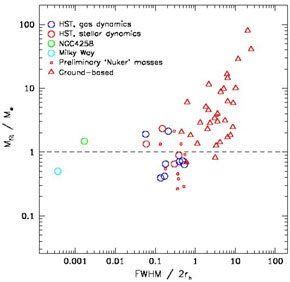
|
Figure 3. "Error" in published black hole
masses, defined as the ratio of the published mass estimate
Mfit to the value
M |
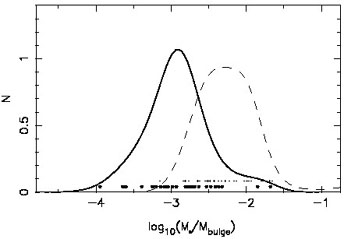
An important quantity is the mean ratio of black hole
mass to bulge mass,
<M /
Mbulge>.
Figure 4 compares the distribution of
Mfit/Mbulge, the mass ratio computed by
Magorrian et al. (1998),
to the distribution obtained when Mfit is replaced
by M as
computed from the
M -
relation.
The mean value of
(M /
Mbulge) drops from 1.7 × 10⁻² to
2.5 × 10⁻³, roughly an order of magnitude.
The mean value of
log10(M / Mbulge) shifts downward by -0.7
corresponding to a factor ~ 5 in
M /
Mbulge.
The density of black holes in the local universe implied by the
lower value of
<M /
Mbulge> is
~ 5 ×
105
M
Mpc-3
(Merritt & Ferrarese
2001a),
consistent with the value
required to explain quasar luminosities assuming
a standard accretion efficiency of 10%
(Chokshi & Turner
1992;
Salucci et al. 1999;
Barger et al. 2001).
|
Figure 4. Frequency function of
black-hole-to-bulge mass ratios (adapted from
Merritt & Ferrarese
2001a).
The dashed curve is the "Magorrian relation"
(Magorrian et al. 1998)
based on black hole masses derived from ground-based kinematics
and two-integral modelling.
The solid curve is the frequency function obtained when
black hole masses are instead computed from the
M |
2.2. Pitfalls of Stellar Dynamical Mass Estimation
Why were most of the stellar dynamical mass estimates
so poor; why were they almost always over-estimates;
and what lessons do past mistakes have for the future?
The answer to the first question is simple in retrospect.
Figure 5 shows how the signal of the black hole - a
sudden rise in the rms stellar velocities at a distance of
~ rh
GM /
2 from the black
hole - is degraded by seeing. For
FWHM/2rh
 2, the signal is so
small as to be almost unrecoverable except with data of exceedingly high
S/N.
Most of the ground-based observations fall into this regime
(Figure 2).
In fact the situation is even worse than
Figure 5 suggests, since for
FWHM
rh, the rise in
(R) will
be measured by only a single data point.
This is the case for many of the galaxies that are listed
as "resolved" in Table 1 (e.g. NGC 3379,
Gebhardt et al. 2000a).
2, the signal is so
small as to be almost unrecoverable except with data of exceedingly high
S/N.
Most of the ground-based observations fall into this regime
(Figure 2).
In fact the situation is even worse than
Figure 5 suggests, since for
FWHM
rh, the rise in
(R) will
be measured by only a single data point.
This is the case for many of the galaxies that are listed
as "resolved" in Table 1 (e.g. NGC 3379,
Gebhardt et al. 2000a).
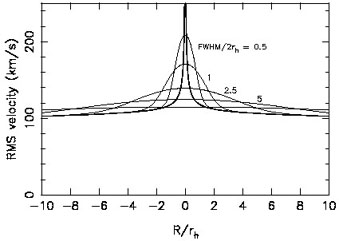
|
Figure 5. Degradation due to seeing of the
velocity dispersion spike
produced by a black hole in a hot (nonrotating) stellar system.
Heavy line is the profile unaffected by seeing; R is the
projected distance from the black hole and rh =
GM |
A short digression is in order at this point. Data taken from the ground often show an impressive central spike in the velocity dispersion profile; examples are NGC 4594 (Kormendy et al. 1996b) and NGC 4486b (Kormendy et al. 1997). However such features are due in part to blending of light from two sides of the nucleus where the rotational velocity has opposite signs and would be almost as impressive even if the black hole were not present. This point was first emphasized by Tonry (1984) in the context of his ground-based M32 observations. As he showed, the velocity dispersion spike in M32 as observed at ~ 1" resolution is consistent with rotational broadening and does not require any increase in the intrinsic velocity dispersion near the center.
Why should poor data lead preferentially to overestimates of
M,
rather than random errors?
There are two reasons. First, as pointed out by
van der Marel (1997),
much of the model-fitting prior to 1999 was carried out
using isotropic spherical models or their axisymmetric analogs,
the so-called "two-integral" (2I) models.
Such models predict a velocity dispersion profile
that gently falls as one moves inward,
for two reasons: non-isothermal cores, i.e.
~
r- with
with
 {0, 2}, generically have
central minima in the rms velocity (e.g.
Dehnen 1993);
and, when flattened, the 2I axisymmetric models
become dominated by nearly circular orbits (in order to maintain
isotropy in the meridional plane) further reducing the predicted
velocities near the center.
Figure 6 illustrates these effects for a set of
axisymmetric 2I models with
= 1.5.
Real galaxies almost always exhibit a monotonic rise in
vrms.
Adding a central point mass can correct this deficiency of the models,
but only an unphysically large value of
Mfit will affect the
stellar motions at large enough radii,
r 0.1
re, to do the trick.
This is probably the explanation for the factor ~ 3 mean error in
M
derived from the best ground-based data (Figure 3).
{0, 2}, generically have
central minima in the rms velocity (e.g.
Dehnen 1993);
and, when flattened, the 2I axisymmetric models
become dominated by nearly circular orbits (in order to maintain
isotropy in the meridional plane) further reducing the predicted
velocities near the center.
Figure 6 illustrates these effects for a set of
axisymmetric 2I models with
= 1.5.
Real galaxies almost always exhibit a monotonic rise in
vrms.
Adding a central point mass can correct this deficiency of the models,
but only an unphysically large value of
Mfit will affect the
stellar motions at large enough radii,
r 0.1
re, to do the trick.
This is probably the explanation for the factor ~ 3 mean error in
M
derived from the best ground-based data (Figure 3).
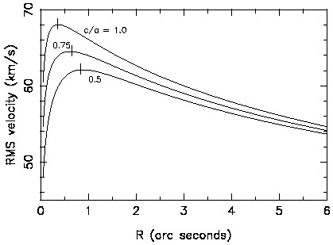
|
Figure 6. Velocity dispersion profiles of the "two-integral" (2I) models that were used as templates for estimating black hole masses in many of the stellar kinematical studies (e.g. Magorrian et al. 1998). Model flattening is indicated as c/a; there are no central black holes. Ticks mark the point Rmax of maximum velocity; Rmax moves outward as the flattening is increased. |
The much larger values of
Mfit /
M
associated with the more distant galaxies in
Figure 3 are probably attributable to
a different factor.
When the data contain no useful information about the black hole mass,
only values of
Mfit that are much larger than the true
mass will significantly affect the
2 of the model fits.
The only black holes that can be "seen" in such data are
excessively massive ones.
Can these problems be overcome by abandoning 2I models in favor
of more general, three-integral (3I) models?
The answer, surprisingly, is "no": making the modelling algorithm
more flexible (without also increasing the amount or quality of the
data) has the effect of weakening the constraints on
M.
The reason is illustrated in Figure 7.
The rms velocities in 2I models are uniquely
determined by the assumed potential, i.e. by
Mfit and
M/L, the mass-to-light ratio assumed for the stars.
This means that the models are highly over-constrained by the
data - there are far more observational constraints (velocities)
than adjustable parameters (Mfit, M/L),
hence one expects to find a unique set of values for
Mfit and M/L that come closest to
reproducing the data.
This is the usual case in problems of statistical estimation
and it implies a well-behaved set of
2 contours with
a unique minimum.
When the same data are modeled using the more general distribution
of orbits available in a 3I model,
the problem becomes under-constrained:
now one has the freedom to adjust the phase-space distribution
function in order to compensate for changes in
Mfit and M/L,
so as to leave the goodness of fit precisely unchanged.
The result is a plateau in
2
(Figure 7), the width
of which depends in a complicated way on the ratio of
observational constraints to number of orbits or phase-space cells
in the modelling algorithm
(Merritt 1994).
Thus, 3I modelling of the ground-based data would
only show that the range of possible values of
Mfit
includes, but is not limited to, the values found using the 2I models;
it would not generate more precise estimates of
M unless
the data quality were also increased.
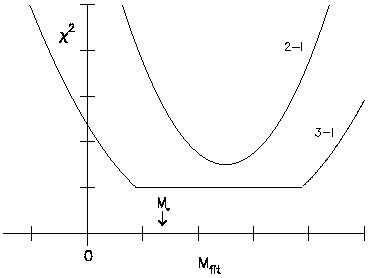
|
Figure 7. Schematic comparison of two-integral (2I) and three-integral (3I) modelling of stellar kinematical data; Mfit is the estimated black hole mass. 2I models predict a unique rms velocity field given an assumed mass distribution; in 3I models, the extra freedom associated with a more general distribution of orbits allows one to compensate for changes in Mfit in such a way as to leave the goodness of fit to the data precisely unchanged. |
The greater difficulty of interpreting results from 3I modelling
has not been widely appreciated; few authors make
a distinction between "indeterminacy" in
M
(the width of the
constant-2 plateau in
Figure 7)
and "uncertainty" (the additional range in
M
allowed by measurement errors), or look carefully
at how their confidence range depends on the number of orbits used.
We illustrate these difficulties by examining two recently published
studies based on high quality, stellar kinematical data.
1. NGC 3379
(Gebhardt et al. 2000a):
The prima-facie evidence
for a central mass concentration in this galaxy consists of a single
data point, the innermost velocity dispersion as measured by HST/FOS;
the rotation curve exhibits no central rise,
in fact it drops monotonically toward the center.
Goodness-of-fit contours generated from 3I models show the expected
plateau (Fig. 7 of Gebhardt et al.), extending from ~ 106
M to
~ 3 × 10⁸
M.
In fact a model with
M = 0
fits the data just as well: the
authors state that "the difference between the no-black hole and
black hole models is so subtle" as to be almost indiscernable
(cf. their Fig. 11). Gebhardt et al. nevertheless argue for
M > 0
based on the poorly-determined
wings of stellar velocity distribution measured within
the central FOS resolution element.
In view of the fact that this velocity distribution
exhibits a puzzling unexplained asymmetry (their Fig. 4),
the stellar dynamical case for a black hole
in this galaxy should probably be considered marginal.
2. NGC 4342
(Cretton and van den
Bosch 1999):
The evidence
for a central mass concentration is again limited to a single data
point, the central FOS velocity dispersion.
Cretton & van den Bosch find that a black-hole-free model provides
"fits to the actual data [that] look almost indistinguishable
from that of Model B" (a model with
Mfit = 3.6 × 10⁸
M).
Their 2 contours
(their Fig. 7) nevertheless seem to show a preferred
black hole mass; however they note that
2 is dominated by the
data at radii
R 5", far
outside of the radius of influence of the black hole.
The probable culprit here is the modest number of orbits (1400,
compared with ~ 250 constraints) in their 3I solutions.
Outer data points are always the most difficult to fit when
modelling via a finite orbit library since only a fraction of the orbits
extend to large radii; this is clear in their fits (cf. their Fig. 8)
which become progessively worse at large radii.
We emphasize that both of these modelling studies were based on
high-quality data, with FWHM / 2rh
0.4 (NGC 3379)
and 0.6 (NGC 4342) (Table 1).
Nevertheless, the extreme freedom associated with 3I models permits a
wide range of black hole masses to be fit to the
velocity data in both galaxies.
As Figure 2 shows, most of the galaxies in the
ongoing HST/STIS survey
of galactic nuclei will be observed at even lower effective resolutions;
hence we predict that the black hole masses in many of these galaxies
will turn out to be consistent with zero and that the range of allowed
masses will usually be large.
(To be fair, we note that these observations were planned at a time when
<M /
Mbulge> was believed to be much larger than it is now.)
We therefore urge caution when interpreting results like
Kormendy & Gebhardt's
(2001)
recent compilation
of black hole masses derived from unpublished 3I modelling.