


The purpose of this section is to illustrate how the redshift surveys carried out over the past few decades have shaped our view of the distribution of galaxies in the local universe. A recent review presenting the current status of the field is given by Huchra & Geller (1991). Again, we make no effort to be complete here. Rather, we attempt to introduce the reader to the topography of the universe.
4.1. Pioneering Redshift Surveys
Despite the Herculean efforts of many astronomers over a fifty year period, our knowledge of the distribution of galaxies in the mid-1970's was still quite fragmentary everywhere beyond the Local Supercluster. Photographic spectroscopy was simply too slow to allow for the rapid accumulation of the thousands of redshifts necessary to begin to map out the large-scale features in the matter distribution of the universe. Only with the advent of electronic detectors for optical spectroscopy, followed soon after by higher sensitivity receivers for 21-cm work, did a more revealing picture of the universe begin to take shape.
Building on the work of Humason et al. (1956), a group of astronomers at the Center for Astrophysics (CfA) led by M. Davis began a redshift survey for all galaxies in the CGCG with magnitudes brighter than 14.5. Known as the CfA Redshift Survey (Davis et al. 1982; Huchra et al. 1983), this effort provided the first wide-field view of the distribution of galaxies in space. Although a shallow survey by today's standards, it set the stage for current redshift surveys by showing for the first time the complexity of the spatial distribution of galaxies. The extremely clumpy, non-uniform nature of the galaxian distribution was further emphasized by small-area surveys of specific regions like Coma and Pisces-Perseus (Gregory & Thompson 1978; Gregory et al. 1981) that led to the recognition of superclusters, and pencil-beam surveys by Kirshner et al. (1978) that led to the discovery of huge underdense regions - voids (Kirshner et al. 1981).
The CfA redshift team extended their program by observing all CGCG galaxies down to magnitude 15.5 in a series of strips across the sky. The first such strip became known as the "Slice of the Universe" (de Lapparent et al. 1986), and covered a 6° × 117° area of the sky in the northern galactic cap. At the same time, the Arecibo HI redshift team was completing their work on the Pisces-Perseus supercluster, and reported their findings for over 2700 galaxies in the southern galactic cap (Haynes & Giovanelli 1986).
In Figure 2 we reproduce the galaxy distribution in the Slice. This figure includes the fainter CGCG galaxies observed by Thorstensen et al. (1989; 1995) and Wegner et al. (1990) in addition to the original sample presented by de Lapparent et al. (1986). It shows in vivid detail that galaxies are indeed not uniformly distributed, but rather are located in clusters and filaments along what the authors describe as "bubble-like" structures. Voids were seen to be a common feature - large fractions of the volume of space are completely devoid of luminous galaxies. The Coma cluster is located near the center of the volume, and lies at the point where several of the filaments converge. A single, continuous filament runs laterally across the volume at velocities between 6000 and 10,000 km s-1, and has been dubbed the "Great Wall". Many additional slices have been observed by the CfA group (Huchra & Geller 1991), and show that these features extend substantial distances in the direction perpendicular to the plane of the Slice. The appearance of the large-scale structure of the local universe, when viewed in these other slices, exhibits the same general features that are present in Figure 2.

|
Figure 2. Cone diagram of the "Slice of the Universe." The figure plots all galaxies with known redshifts in the Slice region (RA 8h to 17h, Dec. 26.5° to 32.5°). The Coma cluster is located near the center of the figure, at the intersection of several filaments. The "Great Wall" runs through the Coma region and can be traced all the way across the volume surveyed. Numerous voids of various sizes and shapes occupy much of this region. |
The Pisces-Perseus Supercluster: A Telling Example One of the most prominent structures seen in the UGC and CGCG catalogs is the Pisces-Perseus supercluster (PPS), a linear structure easily traceable across 5 hours of R.A. at nearly constant redshift cz ~ 5000 km s-1 (e.g., Haynes 1988). Because of the completeness of the redshift information in this region, as well as its distinctive structure, the PPS serves as a useful illustrative example of a number of issues related to large-scale structure studies.
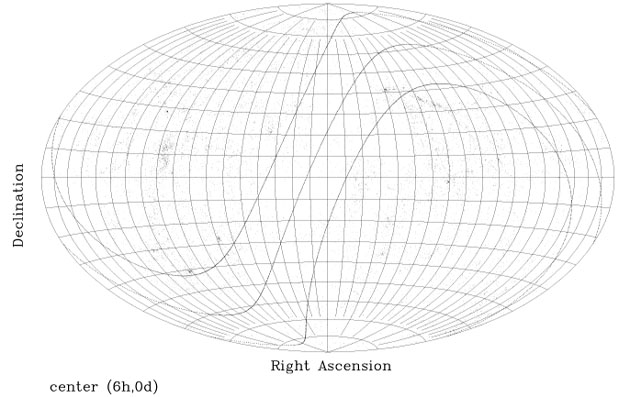
The existence of a large-scale feature in the extragalactic sky in the PP region was noticed as early as 1932 by Bernheimer. It should thus be recognized that PP is not a random volume. Rather, as is apparent in Figure 3, which shows the sky distribution of the nearest 15,000 galaxies (cz < 6000 km s-1), the PPS is one of the three most prominent features seen in a two dimensional examination of moderately bright galaxies, the other two being the zone of avoidance and the Virgo cluster / supergalactic plane. As discussed by Giovanelli et al. (1986), the CGCG is particularly suited to trace volume density enhacements with characteristic sizes of 5 to 20 Mpc if they are situated at a distance of 5000 km s-1. Assuming the luminosity function of galaxies is universal, structures at that distance will be emphasized but not confused by background objects in a catalog containing galaxies to a limited apparent magnitude of 15.7 like the CGCG.
|
Figure 3. All-sky Aitoff projection map showing the positions of the nearest 15,000 galaxies (velocities less than 6000 km s-1). The map coordinates are the same as in Figure 1. The dense concentration of points in the upper right portion of the figure is the Pisces-Perseus supercluster. |
The linear structure of the main ridge of the PPS is clearly evident
in Figure 4 which shows the three- -dimensional
distribution
of galaxies in the current redshift catalog (itself an updated version
of that presented in
Wegner et
al. 1993).
The region illustrated
spans six hours of R.A. in the zone 20° <
 < 50°.
The upper panel shows the sky distribution, while the lower panel shows
the distribution of the 1589 objects with measured redshifts and magnitudes
brighter than 15.7 that lie within the irregular-shaped region outlined in
the upper panel. The main PPS ridge extends more than 45 h-1
Mpc in length
before it fades into the zone of avoidance on the left side of the figure.
It is best described as a linear "filament" of axial ratio 8:1, inclined
by less than 12° to the plane of the sky. It represents a volume
density enhancement of more than a factor of ten over its surroundings.
Numerous clusters are embedded in the filament, most notably the massive
Perseus cluster at RA ~ 3h 15m.
A remarkable bifurcation of the supercluster filament occurs near RA
0h,
where the galaxies in the nearer segment are seen to be confined to an
incredibly narrow range of velocities. The relative isolation of the PPS
from foreground and background structures is seen in
Figure 5, which shows
the cone diagram for the same 1589 galaxies. Note in particular the large
void between the Local Supercluter and PPS.
< 50°.
The upper panel shows the sky distribution, while the lower panel shows
the distribution of the 1589 objects with measured redshifts and magnitudes
brighter than 15.7 that lie within the irregular-shaped region outlined in
the upper panel. The main PPS ridge extends more than 45 h-1
Mpc in length
before it fades into the zone of avoidance on the left side of the figure.
It is best described as a linear "filament" of axial ratio 8:1, inclined
by less than 12° to the plane of the sky. It represents a volume
density enhancement of more than a factor of ten over its surroundings.
Numerous clusters are embedded in the filament, most notably the massive
Perseus cluster at RA ~ 3h 15m.
A remarkable bifurcation of the supercluster filament occurs near RA
0h,
where the galaxies in the nearer segment are seen to be confined to an
incredibly narrow range of velocities. The relative isolation of the PPS
from foreground and background structures is seen in
Figure 5, which shows
the cone diagram for the same 1589 galaxies. Note in particular the large
void between the Local Supercluter and PPS.

|
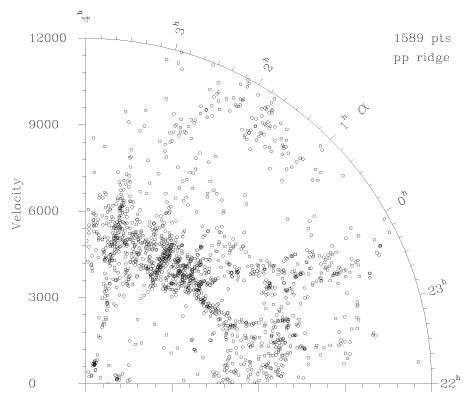
Figure 4. The PP supercluster. The upper figure plots the distribution on the sky of all galaxies with known redshift in the region RA 22h to 4h and Dec. 20° to 50°. The main ridge of the PP supercluster is outlined by the irregular boundary. The lower figure plots redshift vs. RA for those galaxies located within the main PP ridge. Note the strong concentration of galaxies with velocities between 4000 and 6000 km s-1, and the large underdense region in the foreground of the supercluster. |
|
Figure 5. Cone diagram for the 1589 PP galaxies located in the main supercluster ridge outlined in Figure 4. |
4.2. Current Generation of Surveys
Redshift surveys in both the optical and radio have, of course, continued. Important work has been done in the southern hemisphere (da Costa et al. 1988; Pellegrini et al. 1990) which complements the northern surveys mentioned above. By the early 1990's a large fraction of all galaxies in the UGC, CGCG, and ESO catalogs had measured redshifts. This allowed astronomers to look at large tracts of the local universe (effective depths of ~ 6000 - 10,000 km s-1), mapping out details comparable to those evident in Figures 2 - 5. Once astronomers ran out of cataloged objects to observe, they simply began creating new (usually digital) galaxy catalogs in specific regions of the sky to probe even deeper.
For reasons discussed in Section 6, most of
the current generation of wide-area
redshift surveys are being carried out in the optical using multi-object
spectrographs. Two recently completed surveys are the CfA/Dartmouth
Century Survey
(Kent et al. 1993;
Wegner, private communication) and the Las Campanas Redshift Survey (LCRS,
Shectman et
al. 1996).
The Century survey is an extension of the "Slice of the Universe" survey
to fainter apparent magnitudes. It covers a one degree in declination by
100 degrees in RA slice of the sky which overlays the original Slice at
declination 29-30°. The magnitude limit is R = 16.5, and the effective
depth is ~ 25,000 km s-1. The LCRS employs a "plugboard-type"
fiber
positioner to observe up to 100 galaxies in hundreds of 3° ×
1.5° fields. Six different declination strips have been surveyed,
three each in the north and south galactic caps, producing a total of
~ 26,000 redshifts to date. Cone diagrams of the spatial distribution
of the galaxies are shown in
Shectman et
al. (1996).
Large-scale features
out to z  0.15 - 0.20 are
visible, including many voids on the
scale of ~ 5000 km s-1. One of the conclusions of
these deeper surveys is that the sizes of the largest coherent structures
seen are comparable to the PPS and Great Wall, and that by surveying to
depths of 2- -3 times the sizes of these features one reaches the condition
that the redshift samples constitute a "fair sample" of the universe.
Deeper, pencil-beam surveys (e.g.,
Koo et al. 1993)
are probing to even
greater depths. In their examination of the power spectrum of the LCRS,
Landy et al. (1996)
have found a strong peak at ~ 100 h-1 Mpc.
Indications of a periodicity of 128 h-1 Mpc have been
reported in the distribution of redshifts out to and beyond z = 0.2
(Broadhurst et
al. 1990).
0.15 - 0.20 are
visible, including many voids on the
scale of ~ 5000 km s-1. One of the conclusions of
these deeper surveys is that the sizes of the largest coherent structures
seen are comparable to the PPS and Great Wall, and that by surveying to
depths of 2- -3 times the sizes of these features one reaches the condition
that the redshift samples constitute a "fair sample" of the universe.
Deeper, pencil-beam surveys (e.g.,
Koo et al. 1993)
are probing to even
greater depths. In their examination of the power spectrum of the LCRS,
Landy et al. (1996)
have found a strong peak at ~ 100 h-1 Mpc.
Indications of a periodicity of 128 h-1 Mpc have been
reported in the distribution of redshifts out to and beyond z = 0.2
(Broadhurst et
al. 1990).
The future of redshift surveys, at least in the northern hemisphere, will
be dominated by the Sloan Digital Sky Survey (SDSS,
Gunn & Knapp 1993).
Using a dedicated 2.5-m telescope in New Mexico, the SDSS team will
carry out a four-color imaging survey covering roughly one quarter of the
entire sky to a depth of 23rd magnitude. Using the imaging data to
construct catalogs of galaxies, they will then obtain redshifts for an
estimated one
million galaxies to 19th magnitude. This enormous collection of
redshifts will be deep enough to map out large-scale structures at z
0.4!
The survey is expected to begin in the near future, and will require 5-7
years to complete. These are exciting times!