


The Arecibo HI survey provides us with all of the basic data we need
to determine the HI luminosity function, and since HI mass and
luminosity are normally proportional, we can phrase this directly in
terms of HI masses. Assuming that we are dealing
with a representative region of space, the ~ 6000 Mpc3 volume
surveyed overall should allow us to determine the typical number of
objects of different HI masses. Unfortunately, the distance to which the
survey is sensitive for low masses is much smaller (see
Figure 11). At an HI mass of
107
M , the survey only
samples ~ 15 Mpc3 of nearby space, which is probably much less
representative of the universe as a whole. Nevertheless, proceeding
with fingers crossed, in Figure 17 I show
the resulting
density of galaxies in equal logarithmic intervals of HI mass.
, the survey only
samples ~ 15 Mpc3 of nearby space, which is probably much less
representative of the universe as a whole. Nevertheless, proceeding
with fingers crossed, in Figure 17 I show
the resulting
density of galaxies in equal logarithmic intervals of HI mass.
|
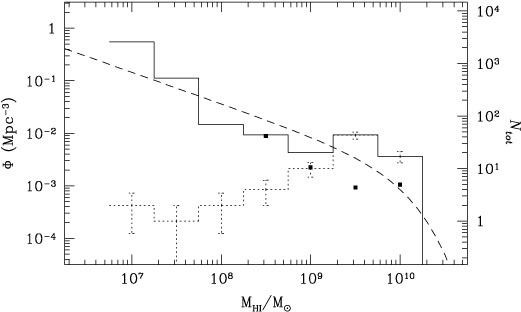
Figure 17.
The HI mass function. The dotted-line histogram shows the
number counts of galaxies actually detected in each half-decade
logarithmic interval, with N1/2 error bars.
The solid histogram
shows the sensitivity-corrected volume density of these same galaxies.
Four squares show similar results from the HI survey of
Henning (1995).
The dashed curve is a Schechter luminosity function with
|
Figure 17 shows the actual counts as a function of HI
mass (dotted line) as well as the density of those sources (solid
line) based on the limiting volume within which a source of that
particular mass could be detected. Note how the number counts of
detected sources drop to tiny numbers even as the number density
grows to huge values. The Figure shows how
 N errors would
affect the counts to give an idea of the uncertainty. The greater
source of error is systematic: the resulting luminosity function
depends critically on our estimate of how big a volume has been
effectively surveyed for the low mass objects. To carry out this
density estimate as accurately as possible, it is important to examine
each source in more detail than just the average volume for that mass
range. The method applied is to calculate the maximum distance (and
hence volume) within which a similar signal could be detected
accounting for its total HI mass, its HI linewidth, and the receiver
sensitivity as a function of frequency.
N errors would
affect the counts to give an idea of the uncertainty. The greater
source of error is systematic: the resulting luminosity function
depends critically on our estimate of how big a volume has been
effectively surveyed for the low mass objects. To carry out this
density estimate as accurately as possible, it is important to examine
each source in more detail than just the average volume for that mass
range. The method applied is to calculate the maximum distance (and
hence volume) within which a similar signal could be detected
accounting for its total HI mass, its HI linewidth, and the receiver
sensitivity as a function of frequency.
The square symbols in the figure show the results from Henning's (1995) analysis of her Green Bank survey. The differences for massive galaxies suggest the range of uncertainty in sensitivity/volume estimates or possibly in variations across the sky. For the three lowest mass bins, the Arecibo survey was sensitive to several times more volume than the Green Bank survey, so it would not be expected that any galaxies would be detected in the Green Bank survey.
The dashed curve is a Schechter function with a power law index of
 = -1.7. It appears that
HI is distributed among galaxies in such
a way that there is a higher fraction of HI in small galaxies
than the corresponding fraction of optical luminosity.
= -1.7. It appears that
HI is distributed among galaxies in such
a way that there is a higher fraction of HI in small galaxies
than the corresponding fraction of optical luminosity.
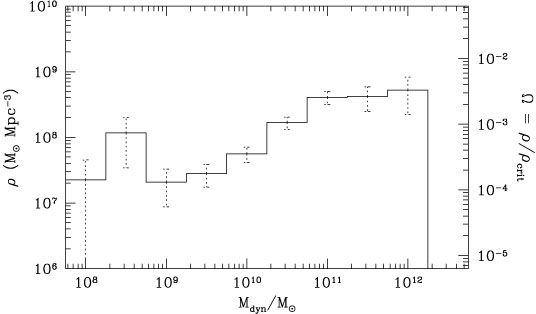
I close by returning to the basic issue raised at the beginning of this chapter. We are finally in a position to make a stab at the elusive mass function of galaxies. The path we've followed to reach this point has many potential pitfalls along the way, and the less adventurous may think it unwise to press forward. Nevertheless, with no small amount of trepidation, I offer Figure 18 for your perusal. This Figure shows the total mass density expected to be present in each mass interval based on dynamical mass estimates for each of the galaxies in the Arecibo survey.
|
Figure 18. The mass function of galaxies projected from the HI-selected sample. Masses of each object were estimated from their size and rotation speed, and the total mass density contributed by galaxies in each logarithmic interval is calculated using the HI sensitivity corrections. N1/2 error bars are based on the number of objects within each interval. The scale on the right gives the corresponding contribution of each mass interval to the closure density of the universe. |
Each galaxy's mass was estimated from its rotation speed (taken from the width of the HI profile) corrected for the inclination estimated from the the optical image. The Holmberg radius of each galaxy was then used to find its mass:

| (8) |
For the nine objects where the optical data were incomplete (and for the face-on objects whose rotation speed could not be estimated), we roughly estimated the total mass to be five times the HI mass, which is probably a conservative estimate. The same correction factors for sensitivity/volume were applied to each object according to its HI signal, and the mass densities in each interval were totaled to arrive at the mass function shown.
Since HI and total dynamical mass are not perfectly correlated, it is certain that this estimate is not going to be quite right, but the result suggests that galaxies make up at most about two percent of the closure density of the universe. The low mass galaxies, while not insignificant, do not appear to contribute as much as the high mass objects. The small number counts at the low mass end, however, leave this conclusion quite uncertain. Clearly, a deeper survey is needed, and I and others are currently in the process of examining new data collected at Arecibo while the telescope was partially crippled as it was being upgraded.
Looking toward the future, the total mass contributed by the galaxies found here is more than a factor of two lower than most estimates of the baryonic mass density determined from Big Bang deuterium synthesis. If, as some people believe, galaxies are mostly composed of non-baryonic matter, then only a fraction of the mass density found here is baryonic. It appears then that the story of where all of the primordial hydrogen went has not yet been told.
Acknowledgments This work would not have been possible without the enormous effort of John Spitzak to complete the Arecibo survey. Portions of this project were supported by NSF Presidential Young Investigator award AST-9158096 and a UMass Faculty Research Grant. I would also like to thank the staff of the Arecibo Observatory for a great deal of assistance.