


5.2. Other Evidence of Second-Order Clusters
The tendency of clouds, clusters, and groups of galaxies to form
assemblages of higher order than single clusters was noted long ago by
Shapley (1933,
1957).
The phenomenon of superclustering was demonstrated dramatically,
however, by the analysis of the
counts by Shane and his associates of galaxies brighter than
mpg  18 on photographs taken for the Lick Astrographic Survey.
Shane and Wirtanen (1954)
describe six clouds
of larger dimension than normal clusters, each containing multiple
condensations. Three
of the Shane-Wirtanen clouds (Nos. 4, 5, and 6) correspond to apparent
groups of two or
more clusters, and two (Nos. 2 and 3) to single clusters in the writer's
catalog of rich
clusters; the remaining clusters in the Shane-Wirtanen clouds apparently
are not rich enough for inclusion. More recently
Shane (1956b)
has called attention to additional rich
aggregations of galaxies, some of which contain several centers of
condensation,
suggesting multiple clusters. Some of these systems are described by
Dr. Shane elsewhere in
this volume. Typical dimensions of these clouds (for H = 50 km
s-1 Mpc-1) lie between 15 and 60 Mpc.
18 on photographs taken for the Lick Astrographic Survey.
Shane and Wirtanen (1954)
describe six clouds
of larger dimension than normal clusters, each containing multiple
condensations. Three
of the Shane-Wirtanen clouds (Nos. 4, 5, and 6) correspond to apparent
groups of two or
more clusters, and two (Nos. 2 and 3) to single clusters in the writer's
catalog of rich
clusters; the remaining clusters in the Shane-Wirtanen clouds apparently
are not rich enough for inclusion. More recently
Shane (1956b)
has called attention to additional rich
aggregations of galaxies, some of which contain several centers of
condensation,
suggesting multiple clusters. Some of these systems are described by
Dr. Shane elsewhere in
this volume. Typical dimensions of these clouds (for H = 50 km
s-1 Mpc-1) lie between 15 and 60 Mpc.
Even the very rich clusters in the writer's catalog
(Abell 1958)
show a strong tendency
for second-order clustering, Of the 2712 clusters catalogued, 1682 were
selected as
comprising a homogeneous statistical sample. Clusters in the sample all
have populations
(defined in Section 3.4) of at least 50,
redshifts in the range
d /
= 0.02 - 0.20, and
lie at great
enough galactic latitudes that interstellar absorption does not prevent
their identification (usually at latitudes greater than about
30°). The surface
distribution of these clusters
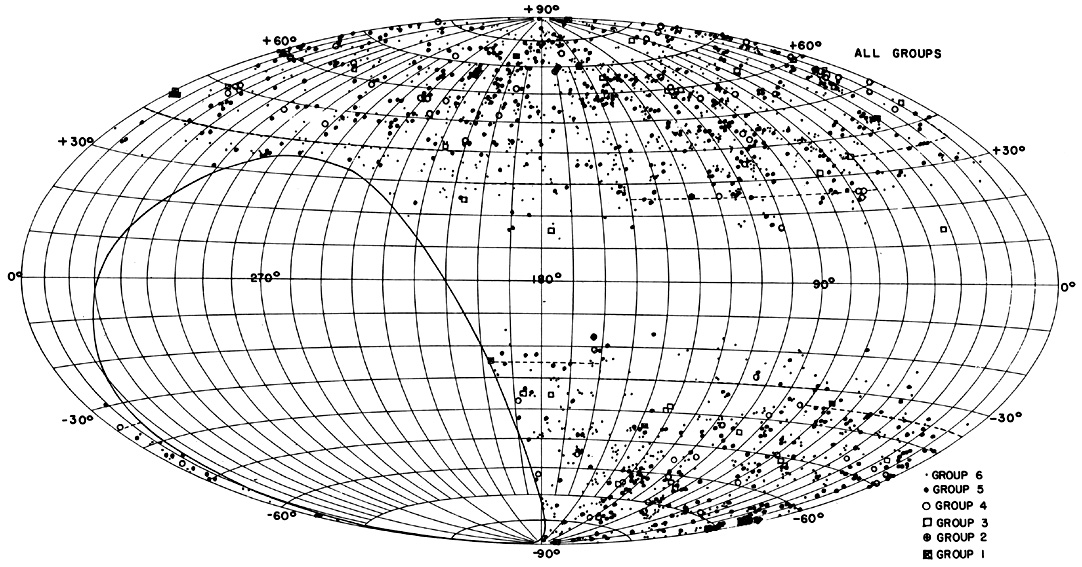
is shown in figure 7. The clusters are
classified according to distance, the mean redshifts
of clusters in distance groups 1 through 6 being, respectively, 0.027,
0.038, 0.067, 0.090, 0.140, and 0.180.
/
= 0.02 - 0.20, and
lie at great
enough galactic latitudes that interstellar absorption does not prevent
their identification (usually at latitudes greater than about
30°). The surface
distribution of these clusters
is shown in figure 7. The clusters are
classified according to distance, the mean redshifts
of clusters in distance groups 1 through 6 being, respectively, 0.027,
0.038, 0.067, 0.090, 0.140, and 0.180.
|
Figure 7. The distribution in galactic coordinates (old system) of the clusters in Abell's catalog. Those clusters closer to the galactic equator than the dotted line are not part of the homogeneous statistical sample. The large empty oval region is the part of the sky not covered by the Palomar Sky Survey. The plot is on an Aitoff equal-area projection. |
Superficial examination of figure 7 shows an
obvious clustering tendency of the
clusters themselves. To test the significance of possible
superclustering, the part of the
sky covered by the homogeneous sample was divided into grid cells of
various sizes, and
for each sized cell the frequency distribution, f (t), of
cells containing t clusters each was
determined. A  2
test was used to estimate the probability that
f (t) would be obtained
in a random sampling from a population whose frequency distribution is
the binomial
distribution, B(t). The f (t) and comparison
with B(t) was determined separately for
clusters in distance groups 5 and 6, and for clusters in distance groups
1 through 4 combined. It was found that f (t) approaches
B(t) for very small cell sizes, for then every
cell contains either one cluster or none. With increasing cell size,
N(t) departs more and
more from B(t); the probability
P(2), of
N(t) being a random sampling from a population
with frequency distribution B(t) for the most distant
clusters (for which the sample
is largest), is as low as 10-30 to 10-40. For
larger cell
areas P(2)
increases again, mainly because the sample size diml area
ones) and the deviation of N(t) from B(t) is
less significant.
P(2)
should also eventually
increase with cell size if the cells become large compared to any
anisotropics in the
cluster distribution - that is, if superclustering is "smoothed out."
The writer originally
interpreted an observed inverse correlation between the cell diameters
for which
P(2)
is a minimum with the cluster distance class as an indication that the
second-order
clustering occurs on the same scale at all distances surveyed. This
interpretation is not
strictly justified because of the smaller significance of the results
for large cell sizes.
However, at cell sizes smaller than those for which
P(2) is at a
minimum, the descent
of P(2)
with cell size is steepest for the most distant clusters
and least steep for the
nearest, as one would expect for superclusters of a common scale
displaying smaller angular sizes at greater distances.
2
test was used to estimate the probability that
f (t) would be obtained
in a random sampling from a population whose frequency distribution is
the binomial
distribution, B(t). The f (t) and comparison
with B(t) was determined separately for
clusters in distance groups 5 and 6, and for clusters in distance groups
1 through 4 combined. It was found that f (t) approaches
B(t) for very small cell sizes, for then every
cell contains either one cluster or none. With increasing cell size,
N(t) departs more and
more from B(t); the probability
P(2), of
N(t) being a random sampling from a population
with frequency distribution B(t) for the most distant
clusters (for which the sample
is largest), is as low as 10-30 to 10-40. For
larger cell
areas P(2)
increases again, mainly because the sample size diml area
ones) and the deviation of N(t) from B(t) is
less significant.
P(2)
should also eventually
increase with cell size if the cells become large compared to any
anisotropics in the
cluster distribution - that is, if superclustering is "smoothed out."
The writer originally
interpreted an observed inverse correlation between the cell diameters
for which
P(2)
is a minimum with the cluster distance class as an indication that the
second-order
clustering occurs on the same scale at all distances surveyed. This
interpretation is not
strictly justified because of the smaller significance of the results
for large cell sizes.
However, at cell sizes smaller than those for which
P(2) is at a
minimum, the descent
of P(2)
with cell size is steepest for the most distant clusters
and least steep for the
nearest, as one would expect for superclusters of a common scale
displaying smaller angular sizes at greater distances.
The evidence that second-order clusters may have similar linear sizes at different distances argues against their being illusions produced by interstellar or intergalactic obscuration. Simple inspection of figure 7 would also seem to rule out absorption as the cause of the clumpy cluster distribution; if apparent clumps of relatively near clusters are merely parts of a uniform or random distribution of clusters seen through holes in absorbing material, then apparent clumps of more remote clusters should be seen in the same directions, but certainly not between them, as is the case.
About 50 apparent groupings of clusters - probably second-order clusters - can be identified in figure 7. The writer has described 17 of these groupings (Abell 1961). The mean number of clusters (in the homogeneous sample) among the 17 second-order groups is 10.6±6.0 (s.d.). This number, of course, refers only to the very rich clusters in the Abell catalog; the total number of clusters and groups of all kinds in a typical second-order cluster might be greater by an order of magnitude or more. The mean linear diameter of the 17 groups of clusters is 78.0± 23.8 (s.d.) Mpc. The list of 17 systems includes two of the Shane clouds - the Corona cloud and the Serpens-Virgo cloud - described elsewhere in this volume.
The distribution of clusters in Volumes 1, 2, 3, and 5 of the Catalogue of Galaxies and Clusters of Galaxies (Zwicky et al. 1961-1968), the first four volumes of the catalog to be published, have been analyzed in the same way as were those in the Abell catalog with nearly identical results by Abell and Seligman (1965, 1967).
Numerous other investigators have attempted analyses of the distribution of rich clusters of galaxies in the published catalogs. Among them, Kiang and Saslaw (1969) computed serial correlations of Abell clusters in 50-Mpc cubic cells to determine the three-dimensional cluster distribution, and find correlations over a scale of at least 100 Mpc and possibly to 200 Mpc. Bogart and Wagoner (1973) performed nearest-neighbor tests on the Abell clusters, and found that the distribution of nearest-neighbor distances from half of the clusters (sources) to the other half (objects) has a significantly smaller mean than does the corresponding distribution when a set of random points is used for sources, indicating that the clusters are significantly clustered. Bogart and Wagoner estimated the scale of the clustering by rotating the "object" half of the clusters in galactic longitude until the distribution of nearest-neighbor distances approached the random one. The angular scale found for distance group 5 clusters is slightly greater than for the more distant group 6 clusters, suggesting a physical association of clusters; the corresponding linear scale is ~ 200 Mpc.
Statistical analyses of three catalogs of extragalactic objects have been carried out recently by the Princeton group (Peebles 1973; Hauser and Peebles 1973; Peebles and Hauser 1974; Peebles 1974). The sources are the Abell (1958) catalog, the galaxies catalogued by Zwicky and his associates (Zwicky et al. 1961-68), and the galaxies catalogued from the Lick Astrographic plates (Shane and Wirtanen 1967). Peebles and Hauser have investigated the correlation between objects in the individual catalogs and the cross correlations of objects in different catalogs. They find that the clusters and individual galaxies seem to correlate in direction, both separately and with each other over angular distances of up to 6°. The linear size of these homogeneities is of the order 100 Mpc.
Peebles has also developed a powerful statistical method for detecting variations over the surface distribution of galaxies or clusters by means of a two-dimensional power spectrum. It was first applied (Yu and Peebles 1969) to test the hypothesis of complete second-order clustering of the Abell catalog clusters. Yu and Peebles found that if second-order clusters contain an average of 10 rich clusters each, then only about 10 percent or less of the Abell clusters can be members of such superclusters, and that in a model of complete superclustering, on the average there could be at most about 2 clusters per supercluster. It should be noted that in these calculations those clusters of distance class 5 in the southern galactic hemisphere, where inspection of figure 7 suggests second-order clustering to be most pronounced, were omitted because that part of the Abell catalog seemed to Yu and Peebles to be atypical.
Peebles (1973) developed the power-spectrum approach further, and he and Hauser reanalyzed the Abell catalog (Hauser and Peebles 1973). They report "clear and direct evidence of superclusters with small angular scale" and that the structure corresponds to an average of 2 to 3 clusters per supercluster.
The early 2 tests
described above are subject to misinterpretation because of the
possibility of a general absorption gradient and other systematic
effects, and the results
of these tests alone should thus be viewed with caution. However, as we
have seen, the
same results are obtained with more sophisticated tests, made possible
with modern
computing equipment, especially the powerful power-spectrum
analysis. These studies
of the catalogs of observed galaxies and clusters of galaxies show very
strong - perhaps
overwhelming - evidence for inhomogeneities in the large-scale
distribution of matter in
space with a scale (for H = 50 km s-1
Mpc-1) of the order of 108 pc.
If Newton's laws are valid over dimensions of second-order clusters, and if the latter do not partake of the general expansion of the Universe, we can use the virial theorem to estimate the velocity dispersion within such a system. We denote the mean separation of its members by R', and have

| (18) |
where  and
R' are in solar masses and parsecs,
respectively. If the mass of a typical
rich cluster is 5 × 10¹⁴
and
R' are in solar masses and parsecs,
respectively. If the mass of a typical
rich cluster is 5 × 10¹⁴
 , the entire mass of
a typical supercluster probably lies in the
range 1015 to 1017
. Adopting 20 Mpc for
R', we find that
<V2>1/2 should lie in the range
300-3000 km s-1. If the velocity field is isotropic, the observed
rms dispersion in radial
velocity should actually lie under 2000 km s-1.
, the entire mass of
a typical supercluster probably lies in the
range 1015 to 1017
. Adopting 20 Mpc for
R', we find that
<V2>1/2 should lie in the range
300-3000 km s-1. If the velocity field is isotropic, the observed
rms dispersion in radial
velocity should actually lie under 2000 km s-1.
Radial velocities are known for six clusters that are suspected of
forming a second-order
cluster covering an elongated region centered near
 =
16h14m,
=
16h14m,
 = + 29°
(Abell 1961).
The total range of these six velocities is about 3000 km
s-1. There are not enough
data to determine a meaningful velocity dispersion for the system, but
at least the
observations are not incompatible with the assumption that gravitational
interactions occur between its members.
= + 29°
(Abell 1961).
The total range of these six velocities is about 3000 km
s-1. There are not enough
data to determine a meaningful velocity dispersion for the system, but
at least the
observations are not incompatible with the assumption that gravitational
interactions occur between its members.
If second-order clusters are expanding, or if they do not have negative
total energy,
the observed dispersion in radial velocities could be higher than the
value derived above.
Suppose, for example, that gravitational forces within such a system are
negligible, and
that it expands at the general universal rate. Then the corresponding
spread of radial
velocities across a second-order cluster of diameter D Mpc should
be  V ~ H
× D = 50 × 75 = 3750 km s-1. Since our
estimate of the value of D is proportional to
H-1, the derived value of
V is
independent of the value assumed for H.
V ~ H
× D = 50 × 75 = 3750 km s-1. Since our
estimate of the value of D is proportional to
H-1, the derived value of
V is
independent of the value assumed for H.