


2.4. The clustering of galaxies
The clumping of galaxies into groups and clusters is especially striking in plots of the distribution of nearby galaxies. Figure 2.5 shows a projection of all the galaxies with bII > 20° in the catalogue compiled by Rood (1981). There is a strong concentration of galaxies at the North Galactic Pole (the Coma cluster) and a prominent band of galaxies stretching almost the whole way across the figure (the Local Supercluster). The effects of projection can be disentangled using redshift as a distance indicator. In Figure 2.6 we show the equivalent projections to Figure 2.5 for four fairly narrow redshift slices. In Figure 2.6a the Virgo cluster and the plane of the Local Supercluster show up very prominently. In Figure 2.6b there are only a few small groups of galaxies and in Figure 2.6c we begin to see some galaxies belonging to the Coma-A1367 supercluster which shows up very prominently in Figure 2.6d.
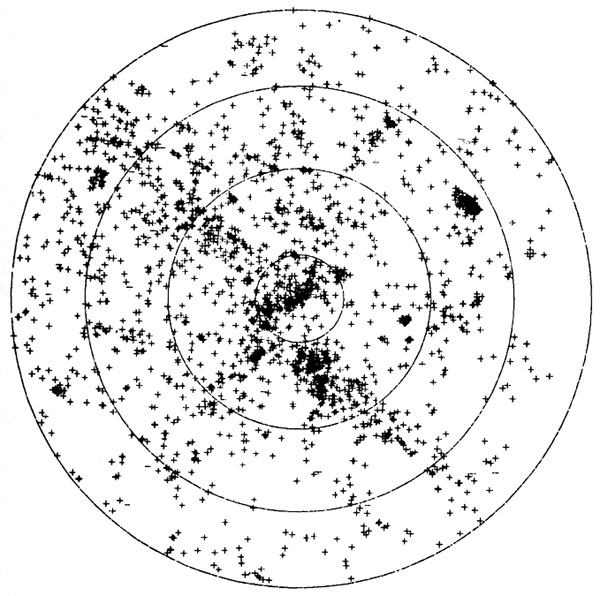 |
Figure 2.5. The distribution of nearby galaxies with bII > 20°, seen in projection. The picture shows about 2400 galaxies and is nearly complete to a magnitude limit B ~ 13. |
Several authors (e.g. de Vaucouleurs, 1975; Tully, 1982) have discussed morphology of the Local Supercluster. The Local Supercluster is, apparently, a highly aspherical disc-like structure with a radius of ~ 15 Mpc and an axial ratio of about 1/6. The existence of superclusters was a controversial issue for many years until the statistical studies of Bogart and Wagoner (1973) and Hauser and Peebles (1973). The issue is now beyond doubt. The large numbers of redshifts now available provide clear evidence of large scale structures. The Coma, Perseus and Hercules superclusters (Gregory and Thompson, 1978; Tarenghi et al. 1979; Gregory, Thompson and Tifft, 1981) have similar. properties to the Local Supercluster, with sizes of ~ 30h-1 Mpc and significant elongations. There is also some tentative evidence for the existence of large holes apparently devoid of any galaxies (Kirshner et al. 1981).
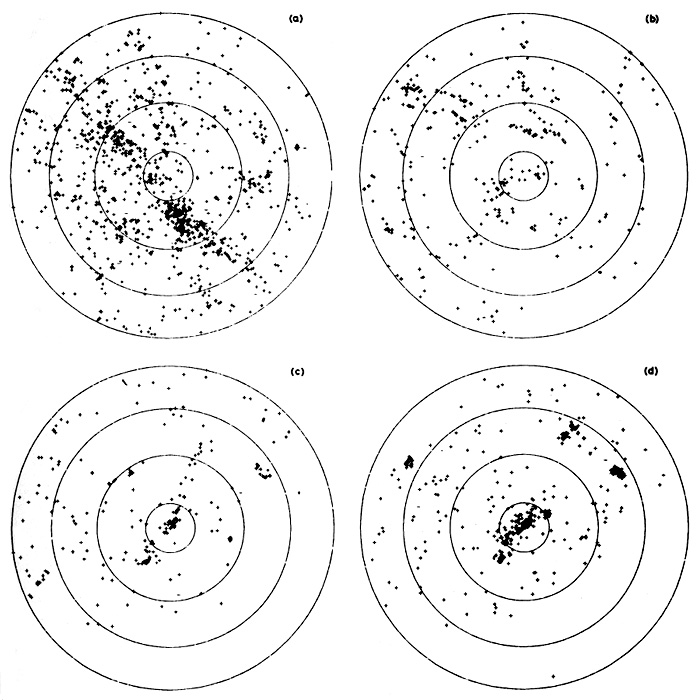 |
Figure 2.6. As in Figure 2.5 except here we show galaxy positions in four separate reshift intervals. (a) Galaxies with radial velocities between 500 km sec-1 and 2500 km sec-1. Here the plane of the Local Supercluster shows up prominently. (b) Galaxies with velocities in the range 2500 km sec-1 and 4500 km sec-1. (c) Galaxies with velocities in the range 4500 km sec-1 and 8500 km sec-1. Here begin to see members of the Coma cluster which is located at the North Galactic Pole. (d) Galaxies with velocities greater than 8500 km sec-1. The Coma cluster shows up very prominently here. |
On still larger scales, Joeveer, Einasto and Tago (1978) claim that the region around the Perseus cluster has a "cell" type structure with galaxies found preferentially in sheets, and rich clusters occurring in chains at sheet intersections. It has also been remarked (Soneira and Peebles, 1978) that the published map of the Lick catalogue (which contains ~ 106 galaxies at a typical depth D* ~ 400 Mpc) gives the impression of "filaments" in the galaxy distribution on scales of up to a few degrees. If the chains and filaments represent real physical associations of galaxies (rather than a "canals of Mars" effect), they would be of great importance for theories of galaxy formation. (4)
4 Kuhn and Uson (1982) have recently described a statistical test which is successful in detecting filaments in the Lick catalogue. Back.