


The existence of SBHs in the nuclei of nearby galaxies has gained
popular consensus
only in recent years. That supermassive black holes must power QSO
activity has, however, been widely suspected since the mid 1960s (e.g.
Robinson et al. 1965).
It is
therefore not surprising that the first studies of black hole demographics
were conducted, over two decades ago, using optical counts of high redshift
QSOs. In a seminal paper entitled "Masses of Quasars",
Andrzej Soltan (1982)
proposed a simple argument: QSO optical number counts yield a
QSO luminosity function which can be integrated to give a mean comoving
energy density in QSO light. After applying the appropriate bolometric
corrections and assuming a reasonable conversion factor of mass into energy,
Soltan concluded that the SBHs powering high redshift (z >
0.3) QSOs comprise a total mass density of ~ 5 × 10⁴
M Mpc-3, each SBH having a mass of 108 - 109
M.
Soltan's arguments, which have been employed many
times in the following years
(Chokshi & Turner 1992;
Small & Blandford 1992;
Salucci et al. 1999),
lead to the inescapable conclusion that most, if
not all, nearby galaxies must host dormant black holes in their nuclei. This
finding has been the main driver for SBH searches in nearby quiescent
galaxies and has kindled the interest in the accretion crisis in nearby
galactic nuclei
(Fabian & Canizares
1988),
ultimately leading to the revival of accretion
mechanisms with low radiative efficiencies
(Rees et al. 1982,
Narayan & Yi 1994).
Mpc-3, each SBH having a mass of 108 - 109
M.
Soltan's arguments, which have been employed many
times in the following years
(Chokshi & Turner 1992;
Small & Blandford 1992;
Salucci et al. 1999),
lead to the inescapable conclusion that most, if
not all, nearby galaxies must host dormant black holes in their nuclei. This
finding has been the main driver for SBH searches in nearby quiescent
galaxies and has kindled the interest in the accretion crisis in nearby
galactic nuclei
(Fabian & Canizares
1988),
ultimately leading to the revival of accretion
mechanisms with low radiative efficiencies
(Rees et al. 1982,
Narayan & Yi 1994).
Armed with recent measurements of the QSO luminosity function from the 2dF
QSO Survey (0.3 < z < 2.3,
Boyle et al. 2000)
and the Sloan Digital Sky Survey (3.0 < z < 5.0,
Fan et al. 2001),
we are in a position to update Soltan's results. If
 (L, z) is the QSO
luminosity function, the cumulative mass density in SBHs which
power QSO activity can be expressed as:
(L, z) is the QSO
luminosity function, the cumulative mass density in SBHs which
power QSO activity can be expressed as:

| (1) |
where the mass accretion rate is simply = Kbol
L -1
c-2, with Kbol the bolometric
correction (from
Elvis et al. 1986),
and the energy
conversion coefficient (assumed equal to 0.1). An
-1
c-2, with Kbol the bolometric
correction (from
Elvis et al. 1986),
and the energy
conversion coefficient (assumed equal to 0.1). An

 = 0.0,
m = 1.0,
H0 = 75 km s-1 Mpc-1 cosmology
is assumed for consistency in comparing the results with those derived
in the following sections.
The cumulative mass density due to QSO accretion is shown in
Fig. 1. It
should be noted that the magnitude limits of the 2dF and Sloan QSO surveys
correspond to Eddington limits on the SBHs masses of 4.5 ×
107
M and
7.3 × 10⁸
M
respectively. Cumulative mass densities down to 106
M are
calculated on the (unverified) assumption that the QSO luminosity function
holds at the corresponding magnitude (B ~ -19). Furthermore, the
lower
redshift limit of integration for the SDSS luminosity function was pushed
down to the high redshift boundary of the 2dF survey (z = 2.3),
although
there are no QSO luminosity functions covering the 2.3 < z
< 3.0 range. For masses larger than 108
M, the
extrapolation from z = 3 to z = 2.3 of the
spatial density (e.g. Fig. 3 of
Fan et al. 2001)
or mass density (Fig. 7 in these
proceedings) as a function of redshift from the SDSS joins rather smoothly
the curve derived from the 2dF survey, therefore our assumption is likely
justified. However, for smaller masses or luminosities, the SDSS mass
density,
extrapolated to z ~ 2.3, overpredicts the QSO mass density (per
unit redshift)
derived from the 2dF data by an order of magnitude. Thus, it is likely that
the linear rise of the SBH cumulative mass density for the high redshift
QSOs between 108 and 106
M
represents an upper bound to the real curve,
which could have been overestimated by a factor of a few (i.e., up to ~
three).
= 0.0,
m = 1.0,
H0 = 75 km s-1 Mpc-1 cosmology
is assumed for consistency in comparing the results with those derived
in the following sections.
The cumulative mass density due to QSO accretion is shown in
Fig. 1. It
should be noted that the magnitude limits of the 2dF and Sloan QSO surveys
correspond to Eddington limits on the SBHs masses of 4.5 ×
107
M and
7.3 × 10⁸
M
respectively. Cumulative mass densities down to 106
M are
calculated on the (unverified) assumption that the QSO luminosity function
holds at the corresponding magnitude (B ~ -19). Furthermore, the
lower
redshift limit of integration for the SDSS luminosity function was pushed
down to the high redshift boundary of the 2dF survey (z = 2.3),
although
there are no QSO luminosity functions covering the 2.3 < z
< 3.0 range. For masses larger than 108
M, the
extrapolation from z = 3 to z = 2.3 of the
spatial density (e.g. Fig. 3 of
Fan et al. 2001)
or mass density (Fig. 7 in these
proceedings) as a function of redshift from the SDSS joins rather smoothly
the curve derived from the 2dF survey, therefore our assumption is likely
justified. However, for smaller masses or luminosities, the SDSS mass
density,
extrapolated to z ~ 2.3, overpredicts the QSO mass density (per
unit redshift)
derived from the 2dF data by an order of magnitude. Thus, it is likely that
the linear rise of the SBH cumulative mass density for the high redshift
QSOs between 108 and 106
M
represents an upper bound to the real curve,
which could have been overestimated by a factor of a few (i.e., up to ~
three).
|
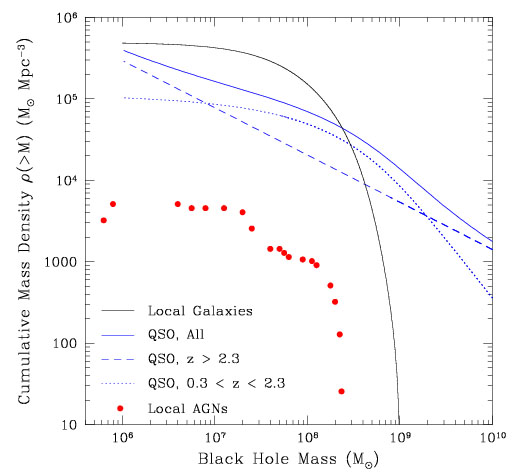
Figure 1. Comparison between the black hole mass function in high redshift QSOs (blue lines - dotted line: 2dF sample; dashed line: SDSS sample; solid line: both samples combined); local AGNs (red) and local quiescent galaxies (black, corresponding to the dotted black line in Fig. 4). |
In short, the cumulative mass density from the optical QSO counts due to
accretion onto high redshift QSOs (0.3 < z < 5.0) appears
to be in the range (2 - 4) × 105
M
Mpc-3. Notice that this estimate does not account for the
possibility that sizable black holes might have already been in place
before the
optically bright phase of QSOs. Furthermore, I have neglected the
contribution to the
SBH mass density from the so called "obscured" or "Type II" QSOs, the
existence of
which is required to explain the observed properties of the X-ray
background. In
analogy with local Seyfert 1 and Seyfert 2 galaxies, in Type II QSOs
molecular
material, with column density in the neighborhood of 1023
cm-2, completely
hides the nucleus from view at optical wavelengths (e.g.
Fabian & Iwasawa 1999).
The contribution of Type II QSOs could be significant. For instance,
Barger et al. (2001)
calculate lower and upper limits of 6 ×
104 and 9 × 10⁵
M
Mpc-3 for the mass density in the SBHs which comprise the
X-ray background.
Gilli, Salvati & Hasinger
(2001)
find that the spectral
shape of the hard (2-10 Kev) X-ray background can be best explained if
obscured
AGNs evolve more rapidly as a function of redshift than do their unobscured
counterparts. Their model assumes a ratio between absorbed and
unabsorbed AGNs
increasing from ~ 4 in the local universe to ~ 10 at z ~ 1.3, and
remaining constant at higher redshifts. Such a model, if correct, would
translate into an
increase by nearly a factor of 10 in the SBH cumulative mass density derived
above.