


3.3.2. Digression on Profile Fitting Functions
I want next to discuss the size and brightness parameters which characterize elliptical and cD galaxies. Since we have no appropriate dynamical models, we can derive such parameters only by using simple analytic fitting functions. To understand how much the resulting parameters can measure, and to establish the most useful functional form, requires a digression on fitting functions. This section closely follows section IIb of Kormendy (1980).
The most commonly used fitting functions for bulges and ellipticals are those of Reynolds (1913) and Hubble (1930),
 |
(1) |
and of de Vaucouleurs (1948),
 |
(2) |
Each function has two characteristic parameters, a brightness scale I0 or Ie and a size scale a or re. Superficially, these parameters appear to measure different properties. I0 is the central surface brightness, and a is the radius of a central, core-like feature. In contrast, re is the radius that contains half of the total light of the model, and Ie is the brightness at re. However, when both functions are fitted to the same data, the parameters are found to be equivalent (Kormendy 1977c):
 |
(3) (4) |
where B0 = - 2.5 log I0 and Be = - 2.5 log Ie. Similar results hold for other two-parameter functions. I therefore choose to use the most convenient function, which is the r1/4 law. However, I would like to emphasize that all results derived below with r1/4 laws can also be derived with other fitting functions such as a Hubble profile.
The exception to the above discussion is the
King (1966)
model applied strictly to the core regions (r
 2rc, rc the isothermal core
radius). To the extent that elliptical galaxies have such cores, the
King models measure physical properties that are not necessarily the
same as those measured with r1/4 laws (although, e.g.,
rc and re are
found to correlate). It is important to note that the Hubble "core
radius" a is not equivalent to rc. The Hubble law ceases to
fit the
observed profiles interior to r ~ a. The role of a is to measure the
profile slope between r ~ a and r ~ 10a,
which is precisely the role of
re in the r1/4 law (see equation 3
and Figure 11).
2rc, rc the isothermal core
radius). To the extent that elliptical galaxies have such cores, the
King models measure physical properties that are not necessarily the
same as those measured with r1/4 laws (although, e.g.,
rc and re are
found to correlate). It is important to note that the Hubble "core
radius" a is not equivalent to rc. The Hubble law ceases to
fit the
observed profiles interior to r ~ a. The role of a is to measure the
profile slope between r ~ a and r ~ 10a,
which is precisely the role of
re in the r1/4 law (see equation 3
and Figure 11).
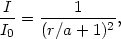
How many parameters can we hope to derive? It is well known that elliptical-galaxy profiles are close to power laws, i.e., the asymptotic form of a Hubble law at r >> a. A power law contains only one scale parameter, say, the brightness at a fixed fiducial radius. How, then, can we measure two parameters with a complicated function which merely mimics a power law? The answer is that the profile is not a power law over the region fitted by a Hubble law. This is illustrated in Figure 11. The parameter a measures the slope of the profile interior to the radius at which the power law begins, i.e., in the radius range in which the profile satisfies an r1/4 law. Thus we are using a (or re) to measure deviations from a power law, which means that we can derive two parameters. However, these deviations are not large. Therefore, we must perform the fit over only that radius range over which the function accurately matches the profile. If we do not demand a precise fit, we do not correctly measure the deviations from a power law, and then the parameters become meaningless. In practice, the way this happens is that the parameters become very strongly coupled in the sense of the discussion below.
 |
Figure 11. The Hubble law plotted against log(r/a) and (r/a)1/4. The heavy line identifies the region found by Kormendy (1977c, see Fig. 6) to describe elliptical galaxies. The segment between the inner tick marks fitted isolated ellipticals, while the portion between the outer ticks fitted (T3) galaxies with companions. In the latter case the rise of the profile above the r1/4 law shown is the inner part of the tidal halo discussed in section 3.3.5. The straight lines shown are an r-2 power law (upper panel) and the best-fitting r1/4 law (lower panel). |
Since elliptical-galaxy profiles are not very different from power laws, they generally do not contain enough information to allow the use of three-parameter fitting functions. Such functions usually fit very well. However, their parameters are very strongly coupled. We can illustrate this with an application of Oemler's (1976) truncated Hubble law,
 |
(5) |
to Coma cluster photometry by Strom and Strom (1977). (I do not mean to single out the extensive Strom and Strom photometry for attack. I use it because it is the only work using a three-parameter function which is published in sufficient detail. In their final analysis, Strom and Strom 1978a use the r1/4 law and so circumvent the present problem.) The problem with three-parameter functions is that the parameters can be varied together by very large amounts without much degrading the fit to the data. This is illustrated in Figure 12. Certainly some of the points in Figure 12c are well determined because the photometry covers a large radius range. But the evident correlation between the parameters, and other properties of the fits which I do not have space to illustrate, indicate that parameter coupling is strong for much of the data. Parameters such as the cutoff radius b can still be useful for some purposes (e.g., Oemler 1976). However, in general it is not possible to make effective use of fitting functions with more than two parameters.
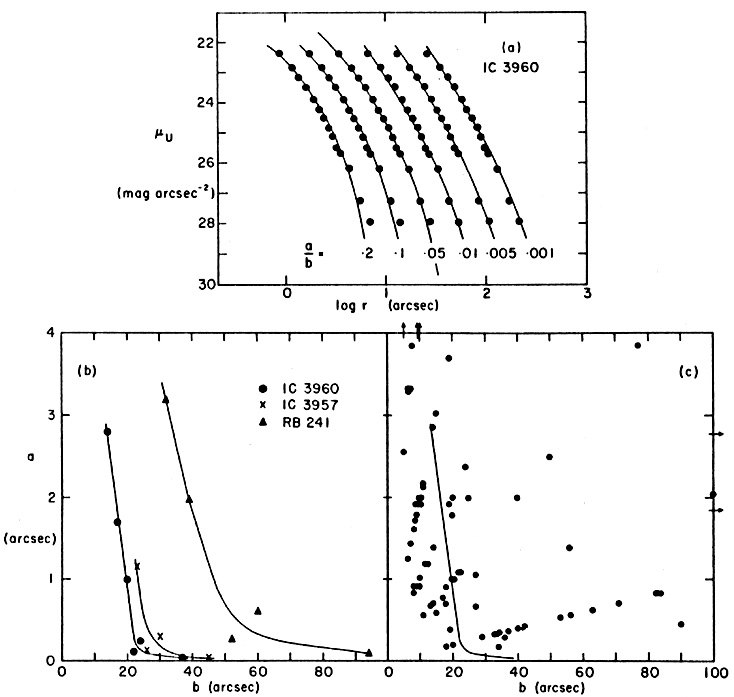 |
Figure 12. (a) Fits of various Oemler (1976) functions (curved lines) to the profile of the elliptical galaxy IC 3960 (points). The magnitude and radius scales apply to the set of points shown with the fit adopted by Strom and Strom (1977), which is the longest line. The other profiles and alternative fits have been shifted arbitrarily in log r to keep them from overlapping. Each curve is labeled with the appropriate value of a/b. The extreme model fits are not as good as the adopted one, but the differences in quality are surprisingly small considering the large range in the parameters. (b) Parameter coupling for the fits in (a) and for two other galaxies. Each point represents one fit to the profile; the curves characterizing the coupling are drawn by hand. Provided that a and b are varied together along these lines, the quality of the fit is relatively good. (c) Observed scatter diagram of the parameters derived by Strom and Strom (1977). Each point represents one galaxy. The points lie along straight lines through the origin because the fits were made by hand using template profiles with a few values of a/b. The scatter of the points along these lines represents the range of luminosities; points for brighter galaxies lie farther from the origin. The obvious correlation that small b tends to imply large a and vice versa [cf. the curve for IC 3960, reproduced from (b)], is probably due to fitting errors. |