


4.2.6. The Dynamical Importance of Rotation in Bulges and Ellipticals
Until 1975 it was believed that elliptical galaxies are simple dynamical systems which are flattened by rotation but which otherwise are like globular clusters or the isotropic King (1966) models (Prendergast and Tomer 1970; Wilson 1975). Soon thereafter it became clear that they are generally triaxial systems with little significant rotation (see Illingworth 1981 for a review). Such objects owe their shapes to anisotropic velocity dispersions (see Binney 1978b, 1981b, 1982a, b for reviews). I will discuss this story briefly, and will then concentrate on recent developments.
The first indication that rotation is unimportant in some ellipticals
came when
Bertola and Capaccioli
(1975)
published a rotation curve
of NGC 4697. They observed a maximum projected rotation
velocity
of ~ 60 km s-1, corresponding to a true rotation of ~ 85
km s-1. This
is remarkably small compared to the central velocity dispersion
 = 310
km s-1 derived by
King and Minkowski
(1966).
Binney (1976)
notes that
the implied ratio of kinetic energies in rotation and random motions is
not enough to maintain the E5 shape of the galaxy. Ironically, a more
accurate dispersion measurement and a rotation curve which reaches
larger radii (Fig. 36) show
that NGC 4697 is
actually one of the few rapidly rotating ellipticals
(Illingworth 1981).
However, the conceptual dam had been burst. Shortly thereafter,
Illingworth (1977)
demonstrated that rotation is too small to account for the observed
flattening in 12 of 13 galaxies studied.
= 310
km s-1 derived by
King and Minkowski
(1966).
Binney (1976)
notes that
the implied ratio of kinetic energies in rotation and random motions is
not enough to maintain the E5 shape of the galaxy. Ironically, a more
accurate dispersion measurement and a rotation curve which reaches
larger radii (Fig. 36) show
that NGC 4697 is
actually one of the few rapidly rotating ellipticals
(Illingworth 1981).
However, the conceptual dam had been burst. Shortly thereafter,
Illingworth (1977)
demonstrated that rotation is too small to account for the observed
flattening in 12 of 13 galaxies studied.
An explanation appeared almost simultaneously, as Binney (1976) realized that protogalactic velocity anisotropies were likely to survive the collapse and lead to ellipticals with anisotropic dispersion tensors. Rotation is then not necessary to produce the flattening. Indeed, there is no reason why any two of the principal dispersion components should be equal, so ellipticals might well be triaxial. Despite the fact that this picture was a conceptual revolution, it became established very quickly, because of the concurrent kinematic measurements, and because triaxial ellipticals provided a natural explanation for the known but neglected observation of isophote twists (section 3.3.1). A great deal of activity was stimulated, including further searches for isophote twists (section 3.3.1), rotation measurements (Peterson 1978b; Sargent et al. 1978; Young et al. 1978b; Schechter and Gunn 1978; Dressler 1979; Jenkins and Scheuer 1980; Efstathiou, Ellis and Carter 1980, 1982; Davies 1981; Carter et al. 1981; Williams 1981; Davies et al. 1983; Davies and Illingworth 1982b; Fried and Illingworth 1982) and theoretical studies (Binney 1978a, b; 1980a, b; 1981b; 1982a, b; Fall 1982).
The results are illustrated in Figures 37,
38a and
46. These are
the usual Vm /
 -
-
 diagrams
(Illingworth 1977),
which compare the global dynamical importance of rotation and random
motions. Recall that Vm /
measures the fraction of the dynamical support which is provided by
rotation: (Vm /
diagrams
(Illingworth 1977),
which compare the global dynamical importance of rotation and random
motions. Recall that Vm /
measures the fraction of the dynamical support which is provided by
rotation: (Vm /
 )2 is
the ratio of rotational to random kinetic energy, where
21/2
)2 is
the ratio of rotational to random kinetic energy, where
21/2  31/2, depending
on the amount of anisotropy.
31/2, depending
on the amount of anisotropy.
Consider first Figure 37, which shows the
now-classical results for bright ellipticals (-19.5
 MB
- 23.5). The predicted
rotation
for isotropic oblate spheroids is shown by the "oblate line", labeled
ISO in the figure. The theoretical parameters are the mass-weighted
mean velocity and dispersion, corrected for projection effects, for
edge-on models of constant ellipticity
. The equation of
the oblate
line is implicit in Binney's derivations; the following explicit
statement is kindly provided by
Fall (1981):
MB
- 23.5). The predicted
rotation
for isotropic oblate spheroids is shown by the "oblate line", labeled
ISO in the figure. The theoretical parameters are the mass-weighted
mean velocity and dispersion, corrected for projection effects, for
edge-on models of constant ellipticity
. The equation of
the oblate
line is implicit in Binney's derivations; the following explicit
statement is kindly provided by
Fall (1981):
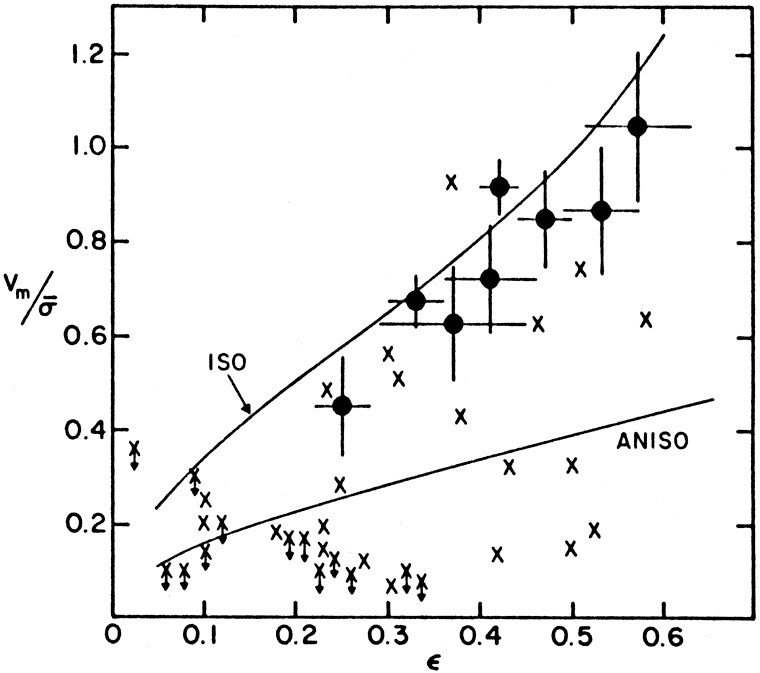 |
Figure 37. Comparison of the dynamical
importance of rotation in
ellipticals (crosses), bulges (circles) and various dynamical models
(curves, from
Binney 1978a,
1980a).
Vm is the maximum projected rotation velocity;
|
 |
(26) |
Here e = (1 - b2 /
a2)1/2 is the eccentricity,
= 1 -
b/a is the
ellipticity, and b/a is the axial ratio. For
back-of-the-envelope
calculations, it is useful to know that the approximation,
 |
(27) |
is correct to (i.e., too large by) 1 ± 1/2% in the entire range
0
0.95 (E0 - E9.5). At small
, equation
(27) is the parabola
 /
=
1/2
referred to by
Binney (1982a).
The oblate line is calculated
for edge-on models. Fortunately, a change in the viewing inclination
moves a model downward along the oblate line if the intrinsic ellipticity
/
=
1/2
referred to by
Binney (1982a).
The oblate line is calculated
for edge-on models. Fortunately, a change in the viewing inclination
moves a model downward along the oblate line if the intrinsic ellipticity
 0.6. This is
illustrated in Figure 1 of
Illingworth (1977),
in which a number of specific models viewed at various inclinations all
fall close to the oblate line. Thus, oblate rotators should lie along
the ISO line in Figure 37 with little scatter.
0.6. This is
illustrated in Figure 1 of
Illingworth (1977),
in which a number of specific models viewed at various inclinations all
fall close to the oblate line. Thus, oblate rotators should lie along
the ISO line in Figure 37 with little scatter.
Before any comparisons with the observations are made, it is
important to note the following complications. First, the published
models show a significant amount of scatter about the oblate line
(Illingworth 1977).
Second, there is no exact observable analogue of the mass-weighted
and
of equation (26).
Binney (1980a)
has shown that Vm /
0,
0 the central
dispersion, approximates
/
, although not
perfectly. Furthermore, it is clear that galaxies are more complicated
than the models. In particular,
usually
varies with radius, and the
maximum rotation and maximum flattening sometimes occur at very
different radii. The adopted values Vm /
and an
average
biased
toward the maximum value are compromises whose derivation is discussed
in Binney (1980a,
1982a),
Kormendy and
Illingworth (1982a)
and Kormendy (1982a).
These complications are not critical as long as any
differences between galaxy samples are large and clearcut, but they
become important when more precise comparisons with the models are made
(e.g., section 5.2).
Figure 37 shows that ellipticals brighter than
MB  -20.5
rotate only 1/3 - 2/3 as rapidly as models of isotropic oblate spheroids.
This means that they have only 1/9 - 1/2 as much rotational energy as
they would need if they were flattened only by rotation. What kind of
model does this low rotation require? One possibility which appears to
fail is a population of isotropic prolate spheroids which has the
observed distribution of flattening.
Binney (1978a,
Fig. 2) has
derived the distribution of such models in the Vm /
-
diagram. The
scatter at a given
is large. For
example, a prolate spheroid seen broadside-on has the same apparent
when viewed
from its rotation axis
as it does in its equatorial plane, but Vm is large in the
latter case
and zero in the former. It is convenient to represent a distribution
of prolata by a median line in the Vm /
-
diagram, such
that half of
the models are expected to fall above the line and half below it. Such
a median line from
Binney (1978a)
is shown in Figure 46. These models
still rotate more rapidly than the galaxies, although the difference is
not large. More consistent with the observations are models with some
dispersion anisotropy (e.g., the ANISO line in
Fig 37, from
Binney 1978a,
Fig. 1). In particular, if the axial velocity dispersion
z is made
smaller than the other two components
r and
-20.5
rotate only 1/3 - 2/3 as rapidly as models of isotropic oblate spheroids.
This means that they have only 1/9 - 1/2 as much rotational energy as
they would need if they were flattened only by rotation. What kind of
model does this low rotation require? One possibility which appears to
fail is a population of isotropic prolate spheroids which has the
observed distribution of flattening.
Binney (1978a,
Fig. 2) has
derived the distribution of such models in the Vm /
-
diagram. The
scatter at a given
is large. For
example, a prolate spheroid seen broadside-on has the same apparent
when viewed
from its rotation axis
as it does in its equatorial plane, but Vm is large in the
latter case
and zero in the former. It is convenient to represent a distribution
of prolata by a median line in the Vm /
-
diagram, such
that half of
the models are expected to fall above the line and half below it. Such
a median line from
Binney (1978a)
is shown in Figure 46. These models
still rotate more rapidly than the galaxies, although the difference is
not large. More consistent with the observations are models with some
dispersion anisotropy (e.g., the ANISO line in
Fig 37, from
Binney 1978a,
Fig. 1). In particular, if the axial velocity dispersion
z is made
smaller than the other two components
r and
 , then relatively
little rotation is required to account for even large amounts of
flattening. Nearly all of the observations can be explained if
1 -
, then relatively
little rotation is required to account for even large amounts of
flattening. Nearly all of the observations can be explained if
1 -  z2
/ r2
is slightly less than 1, say
0.7 < 1 - < 1.0
(Binney 1981b,
Fig. 1a). Of course, a variety of triaxial forms is also
possible. That some ellipticals are triaxial is confirmed by
observations of isophote twists
(section 3.3.1) and minor-axis rotation
(Schechter and Gunn
1978;
Jenkins and Scheuer
1980;
Williams 1981;
Bertola 1981).
z2
/ r2
is slightly less than 1, say
0.7 < 1 - < 1.0
(Binney 1981b,
Fig. 1a). Of course, a variety of triaxial forms is also
possible. That some ellipticals are triaxial is confirmed by
observations of isophote twists
(section 3.3.1) and minor-axis rotation
(Schechter and Gunn
1978;
Jenkins and Scheuer
1980;
Williams 1981;
Bertola 1981).
About 15% of bright ellipticals rotate essentially as rapidly as the oblate models (Illingworth 1981). Two examples are NGC 3557 and NGC 4697 (Illingworth 1977, 1981; Davies 1981).
Rotation rates have also been measured in a number of bulges
(Illingworth and
Schechter 1982;
Kormendy and
Illingworth 1982a;
Kormendy 1982a;
and references therein). As shown in
Figure 37, the
bulges of unbarred galaxies rotate much more rapidly than most bright
ellipticals. In fact, they are essentially consistent with the oblate
line, especially since they are flattened by the disk potential
(Monet, Richstone and
Schechter 1981)
as well as by rotation. Any anisotropy
is very small. Neglecting the disk potential, the bulge data are
formally consistent with
z /
r
0.97. The bulges are
more uniform in
their rotation properties than ellipticals, despite the large range in
Hubble types (S0 - b) and bulge-to-disk ratios (0.25
B/D
11). Note
that the sample in Figure 37 is biased toward small
and
large B/D
(Kormendy and
Illingworth 1982a).
Thus rotation very likely dominates
the dynamics of most bulges. Data on bulges of barred galaxies confirm
this conclusion (section 5.2,
Fig. 46).
 |
Figure 38. (a, upper) Vm /
|
We cannot conclude from the above observations that bulges and
ellipticals are very different.
Schechter (1981)
emphasizes that the
ellipticals in Figure 37 (-19.5
MB
-23.5) are, on average,
brighter than the bulges (
-18.5 MB
-21). Only NGC 4594
has a bulge as bright as the typical elliptical studied
(MB
-22.2). Therefore,
Davies et al. (1983)
have studied the rotation properties of ellipticals fainter than
MB = -20.8, to allow a more direct
comparison with bulges. Also, they aimed to study the importance of
rotation as a function of absolute magnitude, to help to discriminate
between various theories of the origin of angular momentum. The
results are shown in Figure 38. There is a
clear correlation of
rotation properties with absolute magnitude. We can measure the
importance of rotation with a parameter
(V / )*
= (Vm /
)obs
/ ( /
)oblate,
the ratio of the observed value to that predicted by the oblate line.
A plot of (V /
)*
vs. absolute magnitude shows a clear trend. Faint
ellipticals rotate as rapidly as bulges of comparable luminosity;
bright ellipticals have a large spread in rotation measures but
generally rotate slowly. It is not clear whether (V /
)* values for
bulges also correlate with MB, because only one bright
bulge has been
measured in detail (NGC 4594). To clarify any differences between
bulges and ellipticals we need to observe more bright bulges. This
will not be easy, because bulges as luminous as the one in NGC 4594 are
rare and difficult to identify unless they are nearly edge-on.
However, a recent study by
Dressler and Sandage
(1983)
suggests that
very luminous bulges are generally rapid rotators.
Davies and collaborators go on to investigate the implications of the
(V / )*
- MB correlation for theories of galaxy
formation. Their
discussion is beyond the scope of this paper. The main conclusion is
that the shape and especially the amplitude of the (V /
)* -
MB correlation are too large to be produced by tidal
torques during
dissipationless collapse in a hierarchical clustering picture. The data are
more consistent with dissipational galaxy formation. However, a wide
variety of formation processes is possible. The various theories are
not well enough developed to make predictions that can be tested
conclusively.