


10.4. The Baldwin Relationship
This relation, discovered by J. Baldwin in 1977 and confirmed in several
later
studies, is a strong correlation between the equivalent width (EW) of
CIV 1549
and the continuum luminosity. It is clearly observed in radio selected
samples
but seems to be weaker in optical samples. In particular, quasars
discovered on
objective prism plates show a weak, less significant correlation. This
is, perhaps,
not surprising given the fact that these objects are selected by the
strength of
their emission lines. It is also known that the correlation is different
for different
lines, in particular the EW of the optical lines is not well correlated
with the
optical continuum luminosity. Some of the uncertainty is due to the lack
of well selected, bias free samples.
1549
and the continuum luminosity. It is clearly observed in radio selected
samples
but seems to be weaker in optical samples. In particular, quasars
discovered on
objective prism plates show a weak, less significant correlation. This
is, perhaps,
not surprising given the fact that these objects are selected by the
strength of
their emission lines. It is also known that the correlation is different
for different
lines, in particular the EW of the optical lines is not well correlated
with the
optical continuum luminosity. Some of the uncertainty is due to the lack
of well selected, bias free samples.
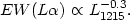
The original sample studied by Baldwin covered only a small range in
continuum luminosity (~ 101.5) and resulted in a well defined
slope for
EW(CIV1549)
vs. L1549. Later studies extended the range to more
than four
orders of magnitude in continuum luminosity, and to a much larger number of
objects. The correlation is still present, but its slope is very
different. An example is shown in Fig. 31 where the
L EW of more than
300 AGNs is compared
with the continuum luminosity at 1215Å. The best (harmonic mean)
slope in this case is -0.3, i.e.
EW of more than
300 AGNs is compared
with the continuum luminosity at 1215Å. The best (harmonic mean)
slope in this case is -0.3, i.e.
| (101) |
A regression analysis for a sub-sample of the same data set, covering
the range
1030  L1215
1031.5 erg
s-1 Å-1, gives a much steeper slope, of
0.5, which
is similar to the original slope found by Baldwin. This change of slope,
as a function of the luminosity range of the sample, is a key to the
understanding of the Baldwin relationship.
L1215
1031.5 erg
s-1 Å-1, gives a much steeper slope, of
0.5, which
is similar to the original slope found by Baldwin. This change of slope,
as a function of the luminosity range of the sample, is a key to the
understanding of the Baldwin relationship.

|
Figure 31.
L |
Several attempts have been made to explain the Baldwin relationship. The
shape of the ionizing continuum may be luminosity dependent in such a way
that the continuum is "softer" in more luminous objects. Because of that the
CIV1549 line
luminosity increases less than the continuum luminosity,
resulting in smaller EW for brighter objects. This cannot be a large
effect since high excitation lines, such as
NV1240 and
OVI1035, are
strong in bright
quasars. Alternatively, the ionization parameter in bright AGNs can be
somewhat smaller than in fainter objects (see the discussion on the
L /
CIV1549
ratio in 10.2). This gives the right tendency but the difficulty with
the high excitation lines is not resolved. Moreover, the Baldwin
relationship for L
cannot be explained in this way, since there is no physical reason for a
decrease
in EW(L) with
increasing continuum luminosity. Photoionization calculations
confirm most of these objections. They show that an increase in U
can explain only a part of the effect, over a part of the observed
luminosity range.
A third possibility is an inverse correlation between continuum luminosity
and the covering factor. The tendency is consistent with the
L vs. continuum
relation shown in Fig. 28, but the
deduced range in covering factor is not
large enough to explain the Baldwin relationship. Also, the dependence
on the luminosity range is not explained.
It has been suggested that large continuum variations, that are not associated with corresponding emission line variations, can produce the observed correlation, This is a plausible explanation for quasars, since emission line variability in them are small compared with the continuum variability. Some confirmation of this idea comes from the fact that the Baldwin diagram for individual Seyfert 1 galaxies, constructed from line and continuum measurements at different phases of activity, is not very different from the original relationship found for a sample of bright quasars.
Lately it has been realized that the presence of geometrically thin accretion disks may introduce an EW-continuum luminosity dependence. This is discussed in the following section.