Copyright © 1999 by Annual Reviews. All rights reserved
| Annu. Rev. Astron. Astrophys. 1999. 37:
603-648 Copyright © 1999 by Annual Reviews. All rights reserved |


7.1. Interpretation of UV Spectra and Colors
Early discussions of low-mass candidates for the UVX in the context of the observations concentrated mainly on distinguishing them from the massive star interpretation rather than from one another. Rose & Tinsley (1974) were the first to emphasize that hot PAGB stars were inevitable products of low-mass evolution and should be present in sufficient numbers to affect the integrated UV spectrum in old populations of all metallicities (assuming mass loss is not so extreme as to suppress the AGB phase altogether). O'Connell (1976) found tentative evidence for hot starlight in the 3300-4000 Å region of 3 gE galaxies, which was plausibly interpreted as from the PAGB. Following the demonstration that normal HB stars in globular cluster-like populations were not compatible with the galaxy UVX spectra (see Section 6.1), PAGB stars became the favored candidates.
Bohlin et al
(1985),
Renzini & Buzzoni
(1986),
O'Connell et al
(1986)
pointed out that the extreme sensitivity of the UV output of
PAGB stars to their core masses might explain the large variation in
UVX strength and the
Faber (1983)
Mg2 correlation. They suggested that metallicity-enhanced
mass loss or age differentials drove the correlation. BBBFL,
Bertelli et al
(1989),
Magris & Bruzual
(1993)
examined the implications of PAGB models
quantitatively. They found that the brightest UVX sources would
require non-PAGB sources of UV light or PAGB stars with core masses smaller
than those in the grid of evolutionary models by
Schönberner
(1983),
the smallest of which was technically a PEAGB rather than a
PAGB star (i.e. it did not reach the AGB tip). They also
concluded that changes in Z alone could not
reproduce the Faber correlation unless there were accompanying changes
in t,
 R, or
Y.
R, or
Y.
Shortly thereafter, two lines of evidence combined to reject PAGB stars as the principal UVX sources. First, GR and the other studies cited in Section 6.2 emphasized the shortfall in the UV output of PAGB objects compared with the strongest upturn galaxies and suggested EHB stars and their descendants as a more viable alternative. Second, HUT spectroscopy showed that the energy distributions of M31 and NGC 1399 declined shortward of 1050 Å (Ferguson et al 1991, Ferguson & Davidsen 1993). This placed an upper limit of Te ~ 25000 K on the temperature of the dominant UVX stars, considerably cooler than the 50000 K characteristic of a PAGB component but entirely consistent with the EHB and post-EHB channels. Ferguson & Davidsen (1993) found significant differences between M31 and NGC 1399 which demonstrated, independent of modeling details, that the UVX is probably a composite population with the mixture of HB and other hot types varying from system to system. (Later HUT observations by Brown et al 1997 confirmed such variations in six other galaxies based on 912-1000 Å fluxes.)
EHB, PEAGB, and AGB-manqué stars have consequently become the favored
candidates for the dominant UVX sources. They are energetically
viable since in the brightest UVX cases only 10-20% of the
evolving stars in the dominant population would need to pass through
the EHB and post-EHB channels to produce the observed far-UV
luminosities (GR, DOR,
Brown et al
1995). DOR showed that the observed 1500-V and
2500-V colors of E galaxies were consistent with composite
EHB/post-EHB and PAGB models in which the EHB channel contributes
~ 25% of the FUV light in medium-upturn systems like M31 but
~ 75% in the strongest upturns. They found that most globular
clusters do not require EHB stars to explain their UV colors, consistent
with independent information on color-magnitude diagrams
(see Figure 7). They also found
that if mass loss is left as a free
parameter, 1500-V does not place useful limits on galaxy age or metal
abundance, though 2500-V does. This is because the properties of the
EHB/post-EHB channels are not very sensitive directly to either
parameter, whereas the main sequence turnoff (which dominates for
 > 2500 Å)
is. DOR found acceptable agreement with observed colors for a
wide range of ages (6-20 Gyr) but only for solar or higher metallicities
(Z ~ 1-4
Z
> 2500 Å)
is. DOR found acceptable agreement with observed colors for a
wide range of ages (6-20 Gyr) but only for solar or higher metallicities
(Z ~ 1-4
Z ),
again leaving mass loss unconstrained.
),
again leaving mass loss unconstrained.
Brown et al (1997)
analyzed HUT spectra of six E/S0 galaxies
covering the 900-1800 Å region at 3 Å resolution. They were
able to produce good fits to the spectra with composite EHB/post-EHB and
PAGB models in which only a small fraction
( 10%) of the
evolving population need pass through the EHB channel
(see Figure 9). Although the models formally
contained very small ranges of MENV on
the ZAHB (e.g. 0.021-0.046
M in
NGC 4649), they found that broader distributions of
MENV would yield similar fits because the short
wavelength FUV flux
tends to be dominated by the hot AGB-manqué phases. The best fits occur
for evolutionary tracks with supersolar values of Z
(2-3 Z)
and Y (0.34-0.45), which produce more flux than subsolar
models below 1200 Å. Interestingly, however, fits are better for
atmospheres with subsolar values of Z (~ 0.1
Z). Brown and colleagues attribute this to the same
processes (mainly diffusion) that create well-known abundance anomalies
among Galactic hot subdwarfs (e.g.
Saffer & Liebert
1995). These effects are not
straightforward to analyze, but the expectation is that diffusion in
high-abundance stars will tend to reduce line strengths and make
spectra appear less metal-rich. This is a critical issue, however, since
the consensus interpretation would have to be fundamentally
revised if the UVX arose from a metal-poor population.
10%) of the
evolving population need pass through the EHB channel
(see Figure 9). Although the models formally
contained very small ranges of MENV on
the ZAHB (e.g. 0.021-0.046
M in
NGC 4649), they found that broader distributions of
MENV would yield similar fits because the short
wavelength FUV flux
tends to be dominated by the hot AGB-manqué phases. The best fits occur
for evolutionary tracks with supersolar values of Z
(2-3 Z)
and Y (0.34-0.45), which produce more flux than subsolar
models below 1200 Å. Interestingly, however, fits are better for
atmospheres with subsolar values of Z (~ 0.1
Z). Brown and colleagues attribute this to the same
processes (mainly diffusion) that create well-known abundance anomalies
among Galactic hot subdwarfs (e.g.
Saffer & Liebert
1995). These effects are not
straightforward to analyze, but the expectation is that diffusion in
high-abundance stars will tend to reduce line strengths and make
spectra appear less metal-rich. This is a critical issue, however, since
the consensus interpretation would have to be fundamentally
revised if the UVX arose from a metal-poor population.
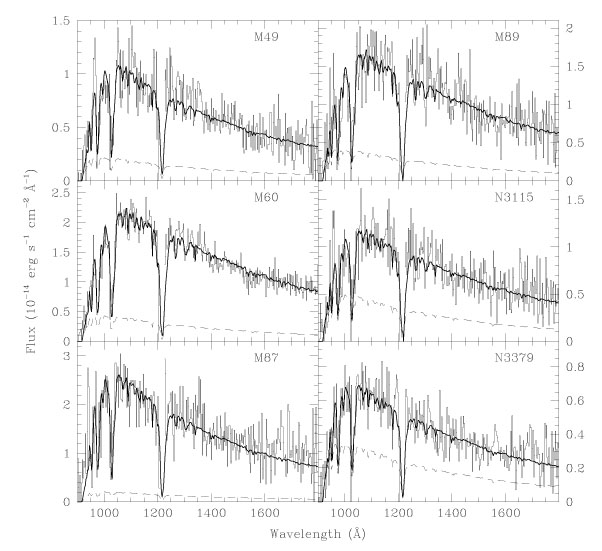 |
Figure 9. Astro/HUT far-UV spectra
of 6 E/S0 galaxies compared with EHB+post-EHB+PAGB models. Fluxes are
shown in
2.5 Å bins. The best-fitting composite models are shown by the
solid lines. These employ evolutionary tracks with
Z ~ 2 - 3
Z |
The DOR and
Brown et al (1997)
analyses were consistent with realistic
global population models but left mass loss on the RGB as a free
parameter because the physics involved are so uncertain. A large body
of other evolutionary spectral synthesis studies adopt definite
prescriptions for mass loss and have predicted the UV spectra of old
populations with the intent of exploring how higher metal abundances
might produce larger UV output (as in
Figure 6).
Some of these
consider a fixed grid of abundance parameters, while others (e.g. the
Padova group,
Bressan et al 1994,
1996)
include self-consistent star
formation and nucleosynthetic enrichment histories to determine the
abundance distribution in galaxy models of various masses. In most of
these models, RGB mass loss is specified by the Reimers prescription
using a fixed mean
R
value in the range ~ 0.3-0.5, as appropriate for globular clusters (e.g.
Bertelli et al 1989,
Barbaro & Olivi
1989,
Bruzual & Charlot
1993,
Magris & Bruzual
1993,
Bressan et al 1994,
Lee 1994,
Bertola et al 1995,
Bressan et al 1996,
Chiosi et al 1997,
Park & Lee
1997).
These model sets do not
include the "hot flash" phase. It is also necessary to specify
the spread of MENV on the ZAHB,
 MENV.
Since the early studies of globular cluster HBs (e.g.
Rood 1973)
it has been traditional to use
a modified Gaussian distribution, though this is neither unique nor
well justified on astrophysical grounds.
MENV.
Since the early studies of globular cluster HBs (e.g.
Rood 1973)
it has been traditional to use
a modified Gaussian distribution, though this is neither unique nor
well justified on astrophysical grounds.
The two-color diagram in Figure 10 (from
Yi et al 1997b)
illustrates the general nature of the
predictions from this class
of models. It shows the effects of age and composition for a grid with
R =
0.7 and
Y /
Z = 3,
somewhat higher values than typically
assumed in the other studies mentioned above. The color-age relation
is nonmonotonic. Far-UV light reaches a minimum at about 5 Gyr, after
the decay of the warm main sequence and before the EHB channel
is well-filled. PAGB stars are always present but are significant in
the UV light only for ages
5-10 Gyr, after
which the EHB and
post-EHB phases dominate. The EHB/post-EHB channel becomes strongly
occupied only when the turnoff mass becomes small enough that the
assumed RGB mass loss yields small-envelope ZAHB stars. In
Figure 10 this occurs after ~ 16 Gyr
for Z
and ~ 8 Gyr for
3 Z,
yielding 1500-V
3. These
threshold ages would decrease by about 5 Gyr for
R = 1
(Yi et al 1997b,
Figure 22). Although
the detailed age-color relation depends on Z, the color loci for
Z
 Z nearly
superpose, implying that the UV colors cannot be easily
used to distinguish Z. Tracks for
R =
1.0 reproduce the
plotted E galaxy data better than those shown here, although these do
encompass the entire color range observed. In particular, the plotted
models allow significantly stronger UV-upturns (1500-V ~ +0.5 and
1500-2500 ~ -1) than actually observed. As indicated by the
labeled points, the observed range of 1500-V (though not 1500-2500)
could be produced at t = 15 Gyr,
R =
0.7 by a change of Z of
a factor of 2, with a concomitant change in Y. Alternatively, within
the modeling uncertainty, the data could be equally well explained by
changes in age at constant abundance or by a correlation between
R
and abundance.
Z nearly
superpose, implying that the UV colors cannot be easily
used to distinguish Z. Tracks for
R =
1.0 reproduce the
plotted E galaxy data better than those shown here, although these do
encompass the entire color range observed. In particular, the plotted
models allow significantly stronger UV-upturns (1500-V ~ +0.5 and
1500-2500 ~ -1) than actually observed. As indicated by the
labeled points, the observed range of 1500-V (though not 1500-2500)
could be produced at t = 15 Gyr,
R =
0.7 by a change of Z of
a factor of 2, with a concomitant change in Y. Alternatively, within
the modeling uncertainty, the data could be equally well explained by
changes in age at constant abundance or by a correlation between
R
and abundance.
 |
Figure 10. IUE color data (same axes as
Figure 7)
for E galaxies compared to theoretical models. From
Yi et al (1997b).
The various symbol shapes correspond to sequences for different
Z, as indicated on the legend. The symbol sizes
increase with age; the
six models in each sequence are for 1, 5, 10, 15, 20, and 25 Gyr. All
models assume a Reimers mass-loss parameter of
|
 =
0.06
M
=
0.06
M