


3.6. Large-Scale Velocity Field:
As already discussed in section 2, the local gravitational field produces peculiar velocities superimposed on the general expansion (35). Measurements of peculiar velocities can provide direct information on the mass content of the Universe, since they can be related to the density fluctuation field, which itself can be observed directly. The basic idea is that a body of mass M will produce a different gravitational field if it is embedded in a low or high density Universe. In a high density Universe it will correspond to a lower density fluctuation than in a low density Universe and thus it will produce weaker/stronger gravitational effects, respectively.
If  (x) =
(
(x) =
( (x)
-
(x)
-  ) /
is the
mass fluctuation at x then using linear
perturbation theory, continuity, Euler and Poisson equations, we
obtain the that the growing mode of the evolution of fluctuations is:
) /
is the
mass fluctuation at x then using linear
perturbation theory, continuity, Euler and Poisson equations, we
obtain the that the growing mode of the evolution of fluctuations is:
|
Note that in the EdS universe we have D(t) = t2/3. Linearizing the mass continuity equation, we obtain:
| (86) |
which has solution:
| (87) |
where the the dipole vector D(x) is related to the
gravitational
acceleration vector and b is the bias factor relating the mass-tracer
fluctuations
(tr) with the
underline mass fluctuation field (72). Note
that in most cases it is expected that b > 1, ie., the
tracer distribution is
more clustered than the matter. This has been born out from the study
of random Gaussian fields in which the higher the density fluctuations
the more clustered they are (cf.
[8])
and from the correlation function
analysis of extragalactic objects by which it was found that the
relative bias factor of IRAS galaxies is
[bcl : bop : bir =
4.5 : 1.3 : 1] (see
[111]).
It is therefore expected that
this hierarchy of decreasing correlations should continue to the
underlying mass distribution. Note that (87) can be written as
[114]:

| (88) |
One then needs good estimates of peculiar velocities, knowledge of the
matter tracer fluctuation field to estimate D(x), and an
understanding of
the biasing between matter and light in order to put constraints on
 m.
m.
Local Group Dipole: The above test was first applied to the Local Group, since from the CMB dipole we have an excellent measurement of its peculiar velocity. The dipole moment, D(x), is measured using different populations of extragalactic objects (IRAS , optical galaxies, AGN's, ABELL/ACO optical or X-ray clusters), weighting each object by r-2 or by a weight proportional to r-2 (like flux, diameter2). Under the assumption that light traces the mass, then the dipole moment is a measure of the peculiar force acting on the LG.
In linear theory the peculiar velocity is parallel to the acceleration and therefore finding an approximate alignment of the two vectors tells us that the fluctuations causing this motion are present within the depths of the sample, provided that the dipole moment converges to its final value before the characteristic depth of the sample. Furthermore, it tells us that possible local non-linear effects do not strongly affect the D(x) determination.
The multipole components of some mass-tracer distribution are
calculated by summing moments. For example the monopole and dipole
terms are: m = 1 / 4
 wi
and D = 3 / 4
wi
ri where wi
wi
and D = 3 / 4
wi
ri where wi
 r-2. The dipole vector, D, is calculated
by weighting the unit directional vector
pointing to the position of each galaxy, with the weight
wi, of that
galaxy and summing over all N available galaxies in the survey. Note
however, that even a uniform distribution would produce a dipole, the
so-called shot-noise dipole, if it is sparsely sampled. The shot
noise error is <D .
D>1/2 = 3 /
4 N1/2
<w2>1/2, and even in a clustered
distribution, the estimated dipole will always have such a shot-noise
contribution which should be taken into account. A further difficulty
is that whole-sky distributions of extragalactic mass-tracers are
unavailable, either due to survey limitations, extinction near the Galactic
plane, cirrus emission, magnitude, flux or diameter limits (which
will cause a different population mix to be sampled at different
depths, and the contributions of the 'faint' or 'small' objects to be
missed). Therefore, complicated corrections should be applied,
which usually have well understood properties and in any case
are always tested with numerical or Monte-Carlo simulations.
r-2. The dipole vector, D, is calculated
by weighting the unit directional vector
pointing to the position of each galaxy, with the weight
wi, of that
galaxy and summing over all N available galaxies in the survey. Note
however, that even a uniform distribution would produce a dipole, the
so-called shot-noise dipole, if it is sparsely sampled. The shot
noise error is <D .
D>1/2 = 3 /
4 N1/2
<w2>1/2, and even in a clustered
distribution, the estimated dipole will always have such a shot-noise
contribution which should be taken into account. A further difficulty
is that whole-sky distributions of extragalactic mass-tracers are
unavailable, either due to survey limitations, extinction near the Galactic
plane, cirrus emission, magnitude, flux or diameter limits (which
will cause a different population mix to be sampled at different
depths, and the contributions of the 'faint' or 'small' objects to be
missed). Therefore, complicated corrections should be applied,
which usually have well understood properties and in any case
are always tested with numerical or Monte-Carlo simulations.
Results from many different galaxy catalogues (optical or IR) tracing depths up to ~ 100 -120 h-1 Mpc, show dipoles that are well aligned with the CMB dipole (mass dipole) which indicates that galaxies trace the mass distribution. Some recent analysis of IRAS galaxies provide values:
|
(cf. [166], [145] and references therein) and
|
(cf. [73]).
The difference between the above values is most probably due to
the different biasing factors ie., bIR <
bop, which is natural since
optical galaxies trace more accurately the deep potential wells
(clusters) while the IRAS galaxies trace better the field. In fact it
has been found that bop / bIR
 1.2 -1.4 (cf.
[111],
[7],
[124] and
references therein). Furthermore, if IR galaxies are biased with
respect to mass (ie., if bIR
1.2 -1.4 (cf.
[111],
[7],
[124] and
references therein). Furthermore, if IR galaxies are biased with
respect to mass (ie., if bIR
 1.2) then the
above results could imply:
m
1.
1.2) then the
above results could imply:
m
1.
|
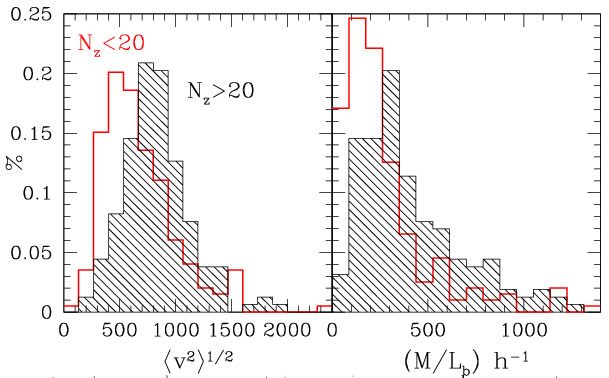
Figure 12. Left panel: Frequency distribution of ABELL/ACO cluster velocity dispersions based on Nz < 20 (empty histogram) and on Nz > 20 (shaded histogram). Right panel: The corresponding M/L distribution. |
Now, galaxy clusters, being the largest gravitationally-collapsed structures in the universe and luminous enough to be detected to very large distances, have also been used to probe the local acceleration field. Most studies are based on the optically selected ABELL/ACO clusters [1] and they provide strong evidence that the LG dipole has significant contributions from depths up to ~ 160h-1 Mpc (see Fig.12 and [152], [122], [26]). However, due to the the volume incompleteness of richness class R=0 clusters (cf. [110]) and to optical projection effects (enhancement of galaxy density along the direction of foreground rich clusters which cause inherently poor background clusters or groups to appear rich enough to be included in the sample), these results had to be checked. Using well defined X-ray cluster samples free of the above effects [51] indeed the results were verified [123]. The results based on optical or X-ray clusters, imply:
|
Note that from the correlation function analysis of ABELL/ACO clusters
[111]
we have that the relative bias factor between clusters and IRAS
galaxies is around bcl,IR
4.5 and if the bias
factor of IRAS galaxies with respect to the mass is bg
 1, then the above results
are consistent with
m
1.
1, then the above results
are consistent with
m
1.
It is extremely interesting that the galaxy distribution in the local
universe (within ~ 100 h-1 Mpc) produces a gravitational
acceleration that is aligned with that produced by the matter distribution
(as determined by the CMB dipole) and in the same time the
distribution of clusters of galaxies on larger scales R
 250 h-1
Mpc produce also a gravitational acceleration aligned with that
of the matter distribution. Furthermore the galaxy and cluster
distributions produce Local Group acceleration profiles that are directly
proportional to each other (see Fig.13), while
the dipole in equal
volume shells, seems to be roughly aligned with the CMB dipole
direction out to very large depths (cf.
[122],
[11]).
This implies
that there is a coherent anisotropy in the mass distribution over
a region with a diameter of ~ 300 h-1 Mpc, which then sets a
lower limit to the scales over which the Cosmological Principle
applies.
250 h-1
Mpc produce also a gravitational acceleration aligned with that
of the matter distribution. Furthermore the galaxy and cluster
distributions produce Local Group acceleration profiles that are directly
proportional to each other (see Fig.13), while
the dipole in equal
volume shells, seems to be roughly aligned with the CMB dipole
direction out to very large depths (cf.
[122],
[11]).
This implies
that there is a coherent anisotropy in the mass distribution over
a region with a diameter of ~ 300 h-1 Mpc, which then sets a
lower limit to the scales over which the Cosmological Principle
applies.
|
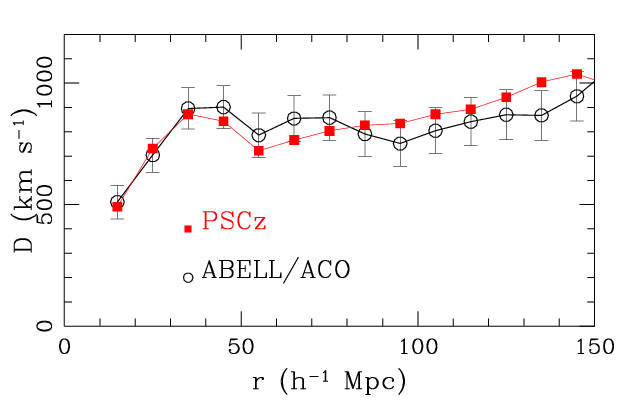
Figure 13. Dipole amplitude build up as a function of distance of the IRAS PSCZ galaxy and the ABELL/ACO cluster samples. The ABELL/ACO cluster dipole has been scaled down by a factor of ~ 4, to take into account the relative bias factor (from [124]). |
However, there is a dichotomy among different studies trying to identify the convergence scale of the dipole, or equivalently what is the largest scale over which we observe bulk motions. The previously discussed dipole studies as well as some peculiar velocity studies (cf. [89], [75], [188]), support the view of a large convergence depth (radius of ~ 150 h-1 Mpc). Other peculiar velocity studies (cf. [38], [41], [40], [36], [39]) support a significantly smaller convergence depth ~ 60 h-1 Mpc.
POTENT - from Radial Velocities to Density Field: In the previous analysis only one velocity was used, that of the Local Group, and although it is very well measured we still have the problem of cosmic variance. Therefore, ideally the velocity-acceleration comparison should be performed for a number of "observers". This has been possible due to the POTENT algorithm proposed in [14] and developed extensively by Dekel and his collaborators (cf. [46] and references therein).
The basic idea follows. The large-scale velocity field, evolving via
gravitational instability, is expected to be irrotational
 × v = 0. This
remains a good approximation in the mildly-nonlinear regime as long as
the field is properly smoothed. This implies that the velocity field can be
derived from a scalar potential,
× v = 0. This
remains a good approximation in the mildly-nonlinear regime as long as
the field is properly smoothed. This implies that the velocity field can be
derived from a scalar potential,
|
and thus the potential can in principle be computed by integration along the lines of sight,
| (89) |
The two missing transverse velocity components are then recovered by
differentiation. Then from (86) we recover the density fluctuation
field, which can then be compared to the observed density field,
determined from large whole-sky surveys. The current sampling of
galaxies enables reliable dynamical analysis, with a smoothing
radius as small as ~ 10 h-1 Mpc, where
| . v|
obtains values larger
than unity and therefore mildly non-linear effects play some role.
|
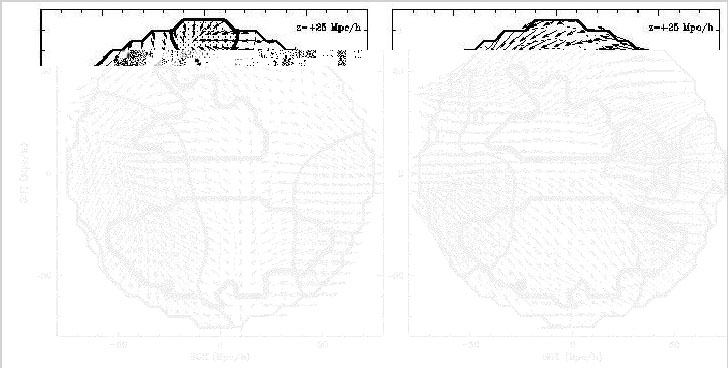
Figure 14. Comparison of predicted density and velocity fields: Left panel shows the observed ABELL/ACO density field and the corresponding predicted velocity field. Right panel shows the matter density field predicted by POTENT and the peculiar velocity field of Mark III galaxies (from [27]). |
The most reliable density-density analysis, incorporating certain mildly non-linear corrections, is the comparison of the IRAS 1.2 Jy redshift survey and the Mark III catalogue of peculiar velocities yielding, at Gaussian smoothing of 12 h-1 Mpc [158]:
|
A similar analysis, using optical galaxies [74] has provided a somewhat lower value:
|
in accordance with the expected higher biasing parameter of optical
galaxies with respect to IRAS ones. These results are consistent with the
dipole analyses and with
m
1 for
bIR
1.2.
However, a variety of methods using v-v comparisons (eg. VELMOD - [187]), developed to compare observed and derived velocities (using either the IRAS or ORS gravity fields), typically yield values of: (cf. [189] and references therein, [28], [18]):
|
|
which are consistent with
m < 1
for any reasonable value of bg.
Therefore, there seems to be a discrepancy between different analyses,
even if in some cases, they use the same data, a fact that needs further
study and tests of the reliability of each method.
A study [27] using the ABELL/ACO clusters to trace the density field and comparing it with the POTENT reconstructed field from the Mark III catalogue of peculiar velocities (see Fig.14) found:

|
in good agreement with the dipole analysis of ABELL/ACO clusters and
consistent with
m
1 for the estimated
value of bcl
[111].
Local Group infall to Virgo: This is an
interesting method to calculate
m on
scales of ~ 10 h-1 Mpc. One relates the Local Group
infall (towards the centre of the Local supercluster) velocity with the
acceleration induced to the LG by the mass overdensity in the Local
Supercluster, assuming a point-mass approximation. We have from (87):
| (90) |
From (72) we have that the galaxy fluctuations is a biased tracer of the underline mass fluctuation field:
| (91) |
Thus from (90) we have:
|
where the mildly non-linear correction on the right-hand side is
according to
[191].
A recent study
[174]
using the SBF method to
determine the local velocity field within cz
3000 km/sec find a
Virgo-centric infall of vin ~ 140 km/sec in agreement
with ~ 160 km/sec,
implied from the Virgo contribution to the X-ray cluster dipole
[123].
Furthermore we have that cz
1005 km/sec
[104],
[149] and
g
2.8 ±
0.5. Therefore we obtain:
|
Although this method of determining
m is
'clean', the fact that the
local peculiar velocity field is affected by mass concentrations well
beyond the Local supercluster introduces a further uncertainty in the
determination of
m.
Velocity-Field results: The outcome of the different large-scale dynamical studies do not converge to a unique value of the mass density parameter. There is need to check the methods and understand the source of this discrepancy. In Table 3 I sum up the different results from the different velocity-field analyses.
| Type of study | m b-1.66IR |
m b-1.66op |
m b-1.66cl |
| Dipole | 0.62 | 0.55 | 0.08 |
| POTENT/Mark III | 0.82 | 0.6 | 0.08 |
| VELMOD | 0.3 | 0.14 | |
| LG-infall | 0.1 | ||