


If a theorist is asked what the large-scale velocity field should look like, she will use the results derived above to calculate the expected amplitude of the bulk flow v(R) averaged over a scale R:
| (7) |
where  is the
Fourier Transform of the smoothing window. It is straightforward to
calculate this quantity as a function of scale for any given power
spectrum (cf., Fig. 9 of
[44]),
but going the other way is
more difficult. If the phases of the Fourier modes of the density field
are random, then each
component of the velocity field has a Gaussian distribution, which means
that v(R) has a
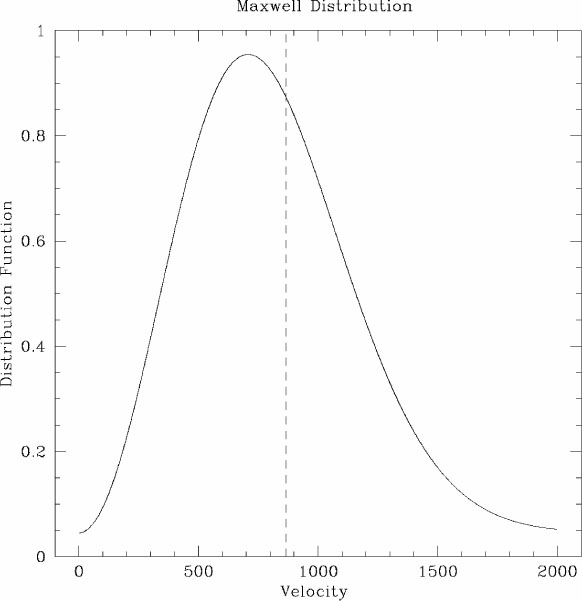
Maxwellian distribution; Fig. 1 reminds
us just how broad such a distribution is. Therefore, a single
measurement of the bulk flow on large scales gives us a relatively weak
handle on the power spectrum.
is the
Fourier Transform of the smoothing window. It is straightforward to
calculate this quantity as a function of scale for any given power
spectrum (cf., Fig. 9 of
[44]),
but going the other way is
more difficult. If the phases of the Fourier modes of the density field
are random, then each
component of the velocity field has a Gaussian distribution, which means
that v(R) has a
Maxwellian distribution; Fig. 1 reminds
us just how broad such a distribution is. Therefore, a single
measurement of the bulk flow on large scales gives us a relatively weak
handle on the power spectrum.
|
Figure 1. The Maxwellian distribution function of expected bulk flows, on a scale on which the rms value is 866 km s-1. Notice how broad the distribution is. |
How then can we constrain the observed power spectrum with observations of the velocity field? Under the random phase hypothesis, the velocity field is given by a multi-variate Gaussian, whose covariance matrix can be calculated directly from the power spectrum ([16]; [17]; [14]; [48]; [20]; [54]). The velocity correlation function is then a tensor with elements given by:

| (8) |
where, in linear perturbation theory,
| (9) |
and K ,
||(x) are appropriate combinations of spherical Bessel
functions.
Thus, if measurements of peculiar velocity for different galaxies are
independent, then the covariance
matrix between radial peculiar velocities ui,
uj of two galaxies iand j separated by a
distance r is given by:
,
||(x) are appropriate combinations of spherical Bessel
functions.
Thus, if measurements of peculiar velocity for different galaxies are
independent, then the covariance
matrix between radial peculiar velocities ui,
uj of two galaxies iand j separated by a
distance r is given by:

| (10) |
where the second term on the right-hand side contains the effects of measurement errors. This allows one to write down a simple expression for the likelihood of observing peculiar velocities of a given set of N galaxies, given a power spectrum:
| (11) |
This has been applied most recently by
[54],
who used the Mark III peculiar velocity compilation of
[51],
[52],
[53]
to constrain the power spectrum (see
[25]
for an independent determination of the power
spectrum from the same data using the statistics of the smoothed
 . v). If they do not apply
the constraint of the COBE
[4]
normalization, they find the best-fit CDM models to have a
. v). If they do not apply
the constraint of the COBE
[4]
normalization, they find the best-fit CDM models to have a


 h = 0.5
± 0.15, which interestingly calls for less large-scale
power than has been implied, e.g., by large-scale redshift surveys.
It is not clear, however, whether the error contributions to the
covariance matrix (Eq. 10) are purely
diagonal. In particular, if there is an error in the assumed distance
indicator relation which is used to
measure peculiar velocities, or if the distance indicator relation is
calibrated from the dataset itself as in
[28],
covariance is introduced between all peculiar velocities, introducing
off-diagonal terms throughout.
The effect of this on the determination of the power spectrum remains an
area for further work.
h = 0.5
± 0.15, which interestingly calls for less large-scale
power than has been implied, e.g., by large-scale redshift surveys.
It is not clear, however, whether the error contributions to the
covariance matrix (Eq. 10) are purely
diagonal. In particular, if there is an error in the assumed distance
indicator relation which is used to
measure peculiar velocities, or if the distance indicator relation is
calibrated from the dataset itself as in
[28],
covariance is introduced between all peculiar velocities, introducing
off-diagonal terms throughout.
The effect of this on the determination of the power spectrum remains an
area for further work.