Copyright © 1998 by Annual Reviews. All rights reserved
| Annu. Rev. Astron. Astrophys. 1998. 36:
599-654 Copyright © 1998 by Annual Reviews. All rights reserved |


Cosmological simulations have numerous applications besides testing of structure formation models. This section presents some of the applications that have become active areas of research. Space limitations preclude discussing many other valuable and often ingenious uses of simulations.
Rich clusters of galaxies are the most massive virialized objects
in the Universe. At the same time, they are sufficiently young,
and the relevant physics sufficiently simple (compared, for example,
with galaxy formation), so that present-day simulations are effective
in exploiting them as a probe of initial conditions. A great many
papers have applied structure-formation simulations to clusters of galaxies
because of their power to constrain cosmological parameters, including
 ,
b, and
,
b, and
 8 (the power
spectrum normalization).
8 (the power
spectrum normalization).
Numerical simulations of galaxy clusters have been used for the following goals, among others: (a) understanding the general processes of formation and evolution of single clusters (galaxy evolution and dynamics, intracluster medium); (b) testing observational methods of mass estimation (for both dark matter and baryons); (c) using the distribution of X-ray temperature (or luminosity, mass, or cluster velocity dispersion) and its evolution to constrain cosmological parameters; and (d) using substructure, morphology, shape, or radial profile to constrain cosmological parameters.
The first cosmological simulations of cluster formation with gas were performed by Evrard (1990), Thomas & Couchman (1992), both of whom combined P3M for gravity with SPH for gas dynamics. These and later simulations (Frenk et al 1996 and references therein) have explored several issues, including the equilibrium and distribution of the hot intracluster gas, the cluster response to mergers, and, in simulations with radiative cooling (Katz & White 1993, Frenk et al 1996), the survival of dissipatively condensed galaxies within dense cluster cores. Figure 3 shows maps of a simulated X-ray cluster at several epochs.
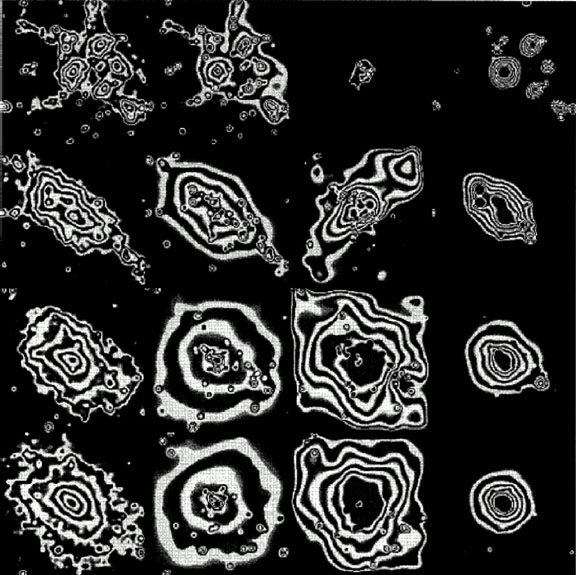 |
Figure 3. Evolution of an X-ray cluster in the standard cold dark matter (CDM) model. Columns from left to right show the projected dark matter density, projected baryon density, emission-weighted temperature, and predicted ROSAT X-ray surface brightness. Rows from top to bottom show the cluster at redshifts z = 0.7, 0.3, 0.1, and 0.03, respectively. From Frenk et al (1996). |
Observers and theorists have devoted much attention to the ratio of velocity
dispersions of galaxies and gas,

 2 /
(kT / µ mp),
where is the
one-dimensional velocity dispersion of galaxies
in the cluster, T is the gas temperature, µ is the
mean molecular
weight, and mp is the proton mass. (Note that this is
a different use
of the symbol
than in Section 3.4.) Direct
measurement of this
quantity in high-resolution simulations (e.g.
Navarro et al 1995)
yields
2 /
(kT / µ mp),
where is the
one-dimensional velocity dispersion of galaxies
in the cluster, T is the gas temperature, µ is the
mean molecular
weight, and mp is the proton mass. (Note that this is
a different use
of the symbol
than in Section 3.4.) Direct
measurement of this
quantity in high-resolution simulations (e.g.
Navarro et al 1995)
yields
 1, as
expected for gas and galaxies that have
fallen through the same potential. Values estimated from fitting the
X-ray surface-brightness distribution yield underestimates by a variety
of effects
(Evrard 1990,
Bahcall & Lubin
1994,
Navarro et al 1995).
1, as
expected for gas and galaxies that have
fallen through the same potential. Values estimated from fitting the
X-ray surface-brightness distribution yield underestimates by a variety
of effects
(Evrard 1990,
Bahcall & Lubin
1994,
Navarro et al 1995).
The reliability of cluster mass estimates based on X-ray observations of the hot gas when assuming hydrostatic equilibrium has been examined by several groups, including Tsai et al (1994), Evrard et al (1996), Bartelmann & Steinmetz (1996). Their papers show that the reliability of the deduced masses depends somewhat on how the X-ray surface-brightness profiles are fit but that accuracies of better than 25% are readily achievable. Bartelmann & Steinmetz (1996), Cen (1997a) also argued that cluster projection effects systematically bias the ratio of masses estimated from X-ray data and gravitational lenses below unity (Bartelmann et al 1996 and references therein).
X-ray measurements of intracluster gas naturally provide an estimate of the gas density as well as the total binding mass. Including the relatively small contribution to baryons made by galaxies in luminous X-ray clusters, the baryon fraction of the mass is found to be
 |
(12) |
(White et al 1993b;,
Evrard 1997
and references therein). Simulations show that
the baryon fraction in clusters is expected to vary little from the
cosmic mean value
(White et al 1993b,
Cen & Ostriker
1994a).
As White et al noted in
the title of their paper ("The baryon content of galaxy clusters - a
challenge to cosmological orthodoxy"), Equation 12 represents a
challenge to cosmological orthodoxy, which favors
= 1, 0.5 <
h < 0.9, and
b
0.015
h-2 from standard Big Bang nucleosynthesis
(Copi et al 1995).
Although a recent measurement of the deuterium abundance
in QSO absorption lines implies the higher value
b
0.019
h-2
(Tytler et al 1996;
S Burles & D Tytler, unpublished manuscript,
astro-ph/9712109), even this value from Big Bang
nucleosynthesis is incompatible with Equation 12 if
= 1. However, the
measured
baryon fraction is perfectly compatible for an open universe or one with a
cosmological constant, lending further support to the LCDM and OCDM models.
Rich clusters are rare objects corresponding to high-density peaks
in the initial conditions. Their abundance is therefore highly
sensitive to the normalization of the power spectrum. Because the
virialized mass of rich clusters roughly equals the mass within a
sphere of radius 8 h-1 Mpc at the
cosmic mean density, the
cluster abundance and its evolution with redshift therefore provide
a strong constraint on
8
(Evrard 1989,
Bahcall & Cen 1992,
White et al 1993a).
The mean mass density parameter
enters
the argument directly through the mass within the sphere; it enters
indirectly
through the scaling of fluctuations from the linear regime (implicit in
8) to the
nonlinear regime of virialized clusters.
Conceptually, this cluster abundance test compares predicted and measured distributions of cluster masses (although X-ray luminosity or velocity dispersion may be used instead). Eke et al (1996) provided a comprehensive analysis leading to the conclusion
 |
(13) |
(Their exponent on
actually differs slightly from -1/2, and it depends weakly on
and
 .)
Fan et al (1997) have
shown recently that the rate of evolution of the cluster abundance
depends on 8
but is insensitive to
, enabling the
degeneracy between these parameters to be broken. They obtained
8 = 0.83
± 0.15 and
= 0.3 ±
0.1. These results are
exciting, but a prudent observer may wish to wait for confirmation
that we really know the cosmological parameters this well.
.)
Fan et al (1997) have
shown recently that the rate of evolution of the cluster abundance
depends on 8
but is insensitive to
, enabling the
degeneracy between these parameters to be broken. They obtained
8 = 0.83
± 0.15 and
= 0.3 ±
0.1. These results are
exciting, but a prudent observer may wish to wait for confirmation
that we really know the cosmological parameters this well.
A different test of
was proposed by
Richstone et al (1992),
who noted that the presence of substructure in clusters
argues that they are dynamically young. Because the growth of clustering
slows greatly when
<< 1, if clusters
indeed formed recently, this would favor a high
. This argument is
qualitative, as
there is neither a perfect measure of substructure nor a unique relation
between substructure and age. Nevertheless, it has inspired much
attention from simulators, beginning with
Evrard et al (1993), who
confirmed the qualitative connection between cluster morphology and
.
Several groups have tested a range of statistical measures
of substructure (with either galaxy counts or X-ray data) using
simulations in an attempt to make a quantitative and robust test
(e.g. Dutta 1995,
Crone et al 1996,
Buote & Tsai 1995,
Pinkney et al 1996).
The latest results appear to favor a low-density
universe with
0.35
(Buote & Xu 1997).
In related work,
Wilson et al (1996b)
showed that reconstructions
of cluster mass distributions by using weak gravitational lensing inversion
should provide enough substructure information to allow
a test of .