Copyright © 1997 by Annual Reviews. All rights reserved
| Annu. Rev. Astron. Astrophys. 1997. 35:
389-443 Copyright © 1997 by Annual Reviews. All rights reserved |


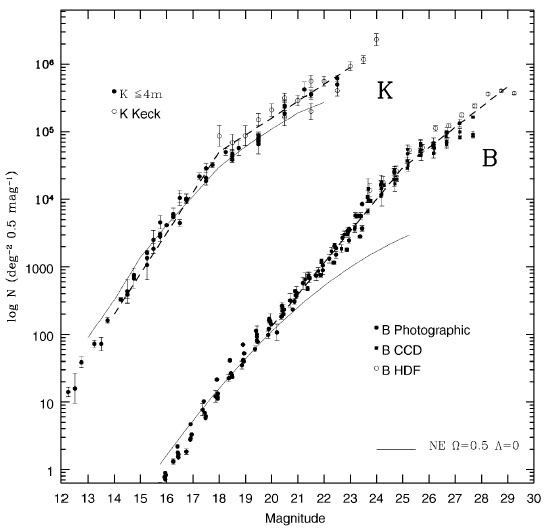
Large format CCD and infrared-sensitive detectors have been used to
extend ground-based number counts since
Koo & Kron's
(1992)
review. The greater depth now available has confirmed a break in the
count slope that occurs, respectively, at around B
 25
(Lilly et al 1991,
Metcalfe et al 1995b)
and K 18
(Gardner et al 1993,
Djorgovski et al 1995,
Moustakas et al 1997)
shown in Figure 5a. The slope,
25
(Lilly et al 1991,
Metcalfe et al 1995b)
and K 18
(Gardner et al 1993,
Djorgovski et al 1995,
Moustakas et al 1997)
shown in Figure 5a. The slope,
 = d logN /
dm, ranges from
B
= 0.47 to 0.30 and from
K
= 0.60 to 0.25, but the surface density at the B break is
30
times higher than that at the K break. If the two effects were
manifestations of the same phenomenon, e.g. a decline in volume density
beyond some redshift
limit, then the mean B-K color should not change significantly across the
break points. In contrast, the change in slope is accompanied by a marked
increase in the number of galaxies with colors B-K < 5, which explains
the steeper
B at fainter limits. Such blue galaxies were originally
referred to as flat spectrum galaxies by
Cowie et al (1989)
because their SEDs approximate ones with constant
f(
= d logN /
dm, ranges from
B
= 0.47 to 0.30 and from
K
= 0.60 to 0.25, but the surface density at the B break is
30
times higher than that at the K break. If the two effects were
manifestations of the same phenomenon, e.g. a decline in volume density
beyond some redshift
limit, then the mean B-K color should not change significantly across the
break points. In contrast, the change in slope is accompanied by a marked
increase in the number of galaxies with colors B-K < 5, which explains
the steeper
B at fainter limits. Such blue galaxies were originally
referred to as flat spectrum galaxies by
Cowie et al (1989)
because their SEDs approximate ones with constant
f( ).
).
 |
 |
Figure 5. (a) Differential galaxy
number magnitude counts in the B and K passbands from the compilation
of
Metcalfe et al
(1996)
augmented with the Keck K counts of
Moustakas et al
(1997).
The K counts have been offset by +1 dex for clarity. The two power law
slopes (dashed lines) drawn have
|
The break in slope and, more importantly,
the disparate behavior between the B and K counts with respect to the
no-evolution predictions makes it unlikely that a major portion of the
excess counts arises via a nonzero cosmological constant,
 ,
as postulated by
Fukugita et al (1990),
Yoshii & Peterson
(1991)
(see Carroll et al 1992
for a full discussion). That such a dramatic excess should be seen in B but
not K could only be consistent with the hypothesis of a nonzero cosmological
constant if the B > 25 sources were significantly more distant than the
K > 19 ones, which seems unlikely
(Section 5). Note again that the K counts,
by virtue of their insensitivity to the k-correction
(Figure 1b), remain an
interesting cosmological probe, although a satisfactory conclusion
concerning
,
as postulated by
Fukugita et al (1990),
Yoshii & Peterson
(1991)
(see Carroll et al 1992
for a full discussion). That such a dramatic excess should be seen in B but
not K could only be consistent with the hypothesis of a nonzero cosmological
constant if the B > 25 sources were significantly more distant than the
K > 19 ones, which seems unlikely
(Section 5). Note again that the K counts,
by virtue of their insensitivity to the k-correction
(Figure 1b), remain an
interesting cosmological probe, although a satisfactory conclusion
concerning  and
will remain
elusive so long as the evolutionary behavior is poorly determined
(Djorgovski et al 1995).
and
will remain
elusive so long as the evolutionary behavior is poorly determined
(Djorgovski et al 1995).
The break in slope more probably signals a transition in galaxy properties at some redshift, with the bulk of the fainter sources being drawn from intrinsically less luminous sources at similar redshifts, a conclusion favored by Lilly et al (1991), Gardner et al (1993), Metcalfe et al (1995b). In this case, the abundance of fainter blue sources would suggest a high volume density of low mass galaxies and the slope of the B and K counts would directly reflect their relative contribution to the luminosity function at that time. Indeed, from Equation 5, clearly the break indicates the apparent magnitude beyond which the contribution of galaxies to the extragalactic background begins to converge. Specifically, in the B band that samples the rest-frame UV at the appropriate redshifts, the location of the break defines, albeit qualitatively, that era in which galaxies contribute most in terms of short-term star formation and associated metal production (Songaila et al 1990, Lilly et al 1996; Section 6).