Copyright © 1997 by Annual Reviews. All rights reserved
| Annu. Rev. Astron. Astrophys. 1997. 35:
309-355 Copyright © 1997 by Annual Reviews. All rights reserved |


Supernovae occur in at least three,
and possibly four or more, spectroscopically distinct varieties. The two
main classes, Types I and II, were firmly established by
Minkowski (1941,
but see
Popper 1937).
Type I SNe are defined by the absence of obvious hydrogen in their optical
spectra, except for possible contamination from superposed H II regions.
SNe II all prominently exhibit hydrogen in their spectra, yet the strength
and profile of the H line vary widely among these objects. Until recently, most spectra of SNe
have been obtained near the epoch of maximum brightness, but in principle
the classification can be made at any time, as long as the spectrum is of
sufficiently high quality. Only occasionally
(Section 5.5) do SNe metamorphose
from one type to another, suggesting the use of hybrid designations.
line vary widely among these objects. Until recently, most spectra of SNe
have been obtained near the epoch of maximum brightness, but in principle
the classification can be made at any time, as long as the spectrum is of
sufficiently high quality. Only occasionally
(Section 5.5) do SNe metamorphose
from one type to another, suggesting the use of hybrid designations.
The early-time (t
 1 week) spectra of
SNe are illustrated in Figure 1.
The lines are broad owing to the high velocities of the ejecta, and most
of them have P Cygni profiles formed by resonant scattering above the
photosphere. SNe Ia are characterized by a deep absorption trough around
6150 Å produced by blueshifted Si II
1 week) spectra of
SNe are illustrated in Figure 1.
The lines are broad owing to the high velocities of the ejecta, and most
of them have P Cygni profiles formed by resonant scattering above the
photosphere. SNe Ia are characterized by a deep absorption trough around
6150 Å produced by blueshifted Si II
 6347, 6371
(collectively called
6355).
Members of the Ib and Ic subclasses do not show this line. The presence of
moderately strong optical He I lines, especially He
I 5876, distinguishes
SNe Ib from SNe Ic
(Wheeler &
Harkness 1986,
Harkness &
Wheeler 1990).
6347, 6371
(collectively called
6355).
Members of the Ib and Ic subclasses do not show this line. The presence of
moderately strong optical He I lines, especially He
I 5876, distinguishes
SNe Ib from SNe Ic
(Wheeler &
Harkness 1986,
Harkness &
Wheeler 1990).
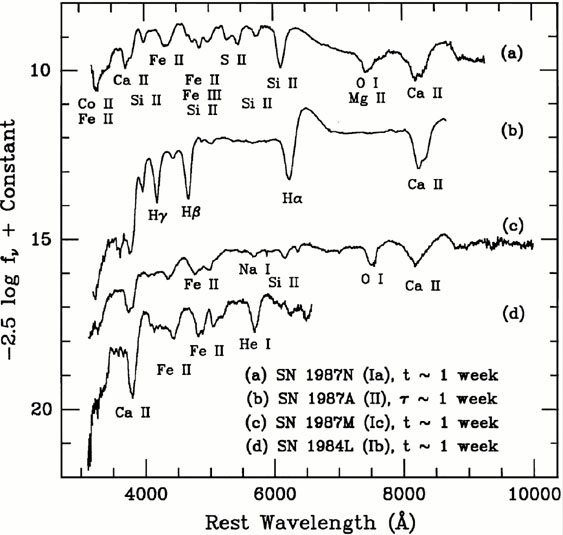 |
Figure 1. Spectra of SNe, showing
early-time distinctions between the four major types and subtypes. The
parent galaxies and their redshifts (kilometers
per second) are as follows: SN 1987N (NGC 7606; 2171), SN 1987A (LMC; 291),
SN 1987M (NGC 2715; 1339), and SN 1984L (NGC 991; 1532). In this review,
the variables t and |
The late-time (t
 4 months) optical
spectra of SNe provide additional constraints on the classification
scheme (Figure 2).
SNe Ia show blends of dozens of Fe emission lines, mixed with some Co lines.
SNe Ib and Ic, on the other hand, have relatively unblended emission lines
of intermediate-mass elements such as O and Ca. Emission lines in SNe Ib
are narrower
(Filippenko et al
1995b) and perhaps stronger
(Wheeler 1980)
than those in SNe Ic, but these conclusions are based on the few existing
late-time spectra of SNe Ib, and no other possibly significant differences
have yet been found. At this phase, SNe II are dominated by the strong
H
emission line; in other respects, most of them spectroscopically resemble
SNe Ib and Ic, but the emission lines are even narrower and weaker
(Filippenko 1988).
The late-time spectra of SNe II show substantial heterogeneity, as do
the early-time spectra.
4 months) optical
spectra of SNe provide additional constraints on the classification
scheme (Figure 2).
SNe Ia show blends of dozens of Fe emission lines, mixed with some Co lines.
SNe Ib and Ic, on the other hand, have relatively unblended emission lines
of intermediate-mass elements such as O and Ca. Emission lines in SNe Ib
are narrower
(Filippenko et al
1995b) and perhaps stronger
(Wheeler 1980)
than those in SNe Ic, but these conclusions are based on the few existing
late-time spectra of SNe Ib, and no other possibly significant differences
have yet been found. At this phase, SNe II are dominated by the strong
H
emission line; in other respects, most of them spectroscopically resemble
SNe Ib and Ic, but the emission lines are even narrower and weaker
(Filippenko 1988).
The late-time spectra of SNe II show substantial heterogeneity, as do
the early-time spectra.
 |
Figure 2. Spectra of SNe, showing late-time
distinctions between various types and subtypes. Notation is the same
as in Figure 1. The parent galaxy of SN 1987L
is NGC 2336 (cz = 2206 km s-1);
others are listed in
the caption of Figure 1. At even later phases,
SN 1987A was dominated by strong emission lines of
H |
At ultraviolet (UV) wavelengths, all SNe I exhibit a very prominent early-time deficit relative to the blackbody fit at optical wavelengths (e.g. Panagia 1987). This is due to line blanketing by multitudes of transitions, primarily those of Fe II and Co II (Branch & Venkatakrishna 1986). The spectra of SNe Ia (but not of SNe Ib/Ic) also appear depressed at IR wavelengths (Meikle et al 1997). The early-time spectra of most SNe II, in contrast, approximate the single-temperature Planck function from UV through IR wavelengths, with occasionally even a slight UV excess. SN 1987A was an exception: The earliest IUE spectra showed a strong UV deficit relative to the blackbody curve defined at optical wavelengths (Danziger et al 1987), as in SNe I.
 represent time after observed B-band maximum and time after core collapse,
respectively. The ordinate units are essentially "AB magnitudes" as defined
by
represent time after observed B-band maximum and time after core collapse,
respectively. The ordinate units are essentially "AB magnitudes" as defined
by