


2.5. The Structure of the Universe Today
The distribution of galaxies in the local universe reveals a striking, hierarchical pattern with a variety of forms such as galaxy clusters and superclusters, voids and bubbles, sheets and filaments (see Figure 1). In the past 20 years, the volume of the universe surveyed has grown immensely, particularly with the recent development of multi-fiber and multi-slit spectrographs, which allow redshifts to be measured for hundreds of galaxies at one time. In the mid-1980's, redshifts for about 30,000 galaxies were measured individually with velocities of up to 15,000 km/sec as part of the CfA survey (Geller and Huchra, 1989).
Unexpected, large-scale structures (walls and bubbles) were revealed with sizes that continued to grow as the survey volumes expanded. In the mid-1990's, about 26,000 additional galaxy redshifts with velocities up to 60,000 km/sec were measured with a multi-fiber spectrograph as part of the Las Campanas survey. The larger (but more sparsely sampled) Las Campanas survey found no new larger structures: the universe had finally revealed its homogeneous nature on the largest scales, as expected from the uniformity of the CMB. The most ambitious large-scale-structure surveys to date are the Anglo-Australian Two-degree Field Galaxy Redshift Survey (2dFGRS), which has compiled almost 250,000 redshifts covering about 5% of the sky, and the on-going Sloan Digital Sky Survey (SDSS), which now has close to half of the 600,000 galaxy redshifts it plans to obtain over about 25% of the sky.
The simplest description of galaxy clustering is the two-point correlation function, which measures the excess probability over random of finding two galaxies separated by a given distance. It is found empirically to follow a simple power law,
 |
which implies that finding another galaxy within 6h-1 Mpc from a given galaxy is twice as likely as finding a galaxy within a circle of radius 6 Mpc placed randomly on the sky. The Fourier transform of the correlation function is the previously discussed power spectrum of the distribution of galaxies. The power spectrum can be directly compared with theoretical predictions from inflation and cold dark matter. A complication in this comparison is the extent to which the light observed in galaxies faithfully traces the distribution of mass. It is now known that galaxies are slightly (10% or so) more clustered than the mass, and that this "biasing" is most pronounced on small scales. That being said, the observed and predicted power spectra (shown in Figure 11) compare well.
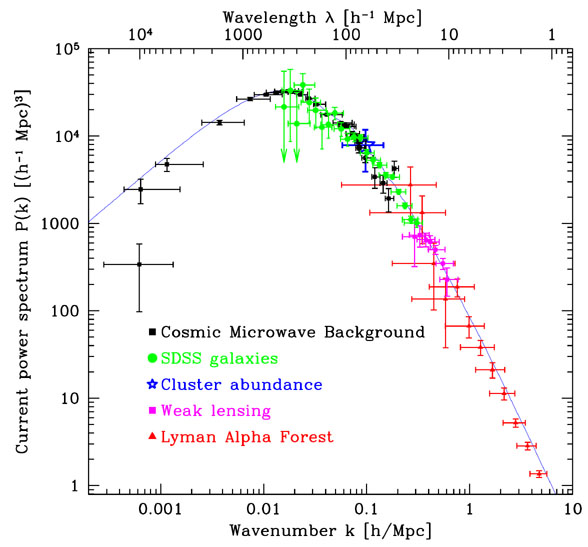 |
Figure 11. Power spectrum of density inhomogeneity today obtained from a variety of measurements including large-scale structure, CMB, weak lensing, rich clusters and the Lyman-alpha forest. The curve is the theoretical prediction for the consensus cosmology model (from Tegmark et al., 2002). |
On the largest scales, the power spectrum, which measures the level of inhomogeneity today, can also be compared with measurements of the anisotropy of the CMB. This measures the level of inhomogeneity when the Universe was only 400,000 years old and the structure existed only as the seed fluctuations. Because the growth of inhomogeneities depends upon the composition of the Universe, the comparison with theory depends also upon cosmological parameters. When the comparison is made, there is reassuring consistency.